Welcome to Tesla Motors Club
Discuss Tesla's Model S, Model 3, Model X, Model Y, Cybertruck, Roadster and More.
Register

TSLA Technical Analysis

This site may earn commission on affiliate links.
Interesting, when I draw the lines on my tool on the daily chart I get not parallel lines but a megaphone, both on the linear and log chart.

Today is a very low volume day, maybe because of the Taycan release and some people wait for more Tesla August sales figures. Chanos and friends used this opportunity apparently to drive the price down during lunch hours.

Gapping up on good Tesla news within the next days would be very constructive. Seems to me that most bad expectations (except for an extreme China politics event) are already built in the SP, so there seem to be good chances for a positive surprise.

On another note, the two gaps from last week have not (yet) been closed and below chart shows some cups forming since the gap up last Friday which suggests some longs may be accumulating slowly during the bear attacks.

View attachment 450406
Where do you see the megaphone pattern? The only one I see is on the monthly multi-year chart.

The downward parallel channel I posted above can be seen on the daily and 4 hour charts.

See also this:

The Chart Guys
 
  • Informative
Reactions: Stars aligned
Where do you see the megaphone pattern? The only one I see is on the monthly multi-year chart.

The downward parallel channel I posted above can be seen on the daily and 4 hour charts.
Right here, looks broadening to me:
upload_2019-9-4_19-55-24.png
 
  • Helpful
Reactions: Antares Nebula
A breakout for Tesla is in the cards, as the chart shows the SP reaching the upper end of the saucer pattern which started to develop on the 24th July. The pattern repeats itself within the formation, such as from August 13 till September 10. This is helped by the broader market which appears to break out of the rising wedge which in this case will be a consolidation pattern.

upload_2019-9-12_9-4-31.pngupload_2019-9-12_9-5-25.png

Fundamentally, the breakout is well founded on 1) the recent relaxation in the trade war, 2) the positioning of the broader markets, leaving many underinvested in risk assets 3) a strong US economy 4) a steady stream of good news from Tesla on production, deliveries, product developments, financials and market acceptance / brand recognition. It starts firing on all cylinders, or shall I better say traction on all wheels?

As for Teslas financial situation, I find below charts very interesting (source: Mayur M Thaker, CFA@freshjiva ). It shows clearly what we all expect - that Tesla is much undervalued, compared to the years before.

Probability is good that the circumstances lead to a massive rally as new investors discover the company, many play catch up the raising prices and shorts will be forced to buy in. It could very well end up in an explosive upwards movement, lasting for many months, the contrary of a "meh rally". It might be the very start of Tesla becoming the next poster share.

Note to myself: hold tight on those damn shares!

EEMsYr5X4AAIPLd

EARTAFDWkAcUNS8
 
Craig Johnson is a managing director and chief technical research analyst at Piper Jaffray. He was one of my regular guests on my financial news TV show in Chicago. Even though I am long retired, he continues to email me complimentary copies of his weekly newsletter.

On 2013 JAN 28 one of his technical recommendations was TSLA. I had not heard of it or its cars, but then thoroughly researched Tesla Motors and Elon Musk, before loading up on more of the stock each day that week. I suspected I may have found my long sought ten-bagger.

Until today, I can only recall one other time that Craig recommended TSLA. But he is doing so again this morning due to what he reads as its positive chart. :cool:
 
Last edited:
Following the release of the Q2 earnings report, a technical "gap" was created in the TSLA chart. That was from the low of $258.16 on July 24 down to the high of $234.50 on July 25. Today the gap was filled with the day's high of $258.55. That's a potentially bullish technical sign, although it needs to be confirmed with follow-up strength. :cool:
 
  • Informative
Reactions: ev-enthusiast
While everybody is jumping up and down in the general thread (rightfully so), I thought it could be useful to try and determine what we can expect from the stock technically right now. Mainly I am taking profits gradually with some $400 JAN2021 LEAPS and I'd like to maximize gains.

Looking at the monthly and weekly chart I think it is clear TSLA has re-entered the 300-380 trading range.

This trading range was held during the following periods:
- april 2017 to march 2018 (=around twelve months or four quarters)
- june 2018 to august 2018 (=around three months or one quarter)
- (end of) october 2018 - february 2019 (=around three months or one quarter)

I'll go out on a limb and predict that the $300 barrier won't break down at least for the duration of one quarter (see above). Only serious negative news, i.e. a bad ER, could move the stock this significantly.

Currently we are still in the process of climbing due to covering by margin called shorts and bulls wanting to get in. As was pointed out in the general thread, Q3 2018 had similar effects on day 2 after the ER where we firstly had an MMD, and afterwards rose 5%.

Today a 5% rise would put the SP at $314,67. The current high of the day has exceeded that ($314,98) but dropped below immediately.

For this trading day I wouldn't expect the SP to go much higher than this ($315 let's say). If we instead break through $315 on volume, I'd say we have a good chance of rising above $320.

I was going to extend this post with more predictions, but I'm out of time at the moment.

I'd like to hear your thoughts on the short and medium term resistance levels. I'll try and look into it soon.

GLTA
 
  • Like
Reactions: Antares Nebula
While everybody is jumping up and down in the general thread (rightfully so), I thought it could be useful to try and determine what we can expect from the stock technically right now. Mainly I am taking profits gradually with some $400 JAN2021 LEAPS and I'd like to maximize gains.

Looking at the monthly and weekly chart I think it is clear TSLA has re-entered the 300-380 trading range.

This trading range was held during the following periods:
- april 2017 to march 2018 (=around twelve months or four quarters)
- june 2018 to august 2018 (=around three months or one quarter)
- (end of) october 2018 - february 2019 (=around three months or one quarter)

I'll go out on a limb and predict that the $300 barrier won't break down at least for the duration of one quarter (see above). Only serious negative news, i.e. a bad ER, could move the stock this significantly.

Currently we are still in the process of climbing due to covering by margin called shorts and bulls wanting to get in. As was pointed out in the general thread, Q3 2018 had similar effects on day 2 after the ER where we firstly had an MMD, and afterwards rose 5%.

Today a 5% rise would put the SP at $314,67. The current high of the day has exceeded that ($314,98) but dropped below immediately.

For this trading day I wouldn't expect the SP to go much higher than this ($315 let's say). If we instead break through $315 on volume, I'd say we have a good chance of rising above $320.

I was going to extend this post with more predictions, but I'm out of time at the moment.

I'd like to hear your thoughts on the short and medium term resistance levels. I'll try and look into it soon.

GLTA

See my comment below in the main thread. It seems like we are back in the 300-380 range as you say, and perhaps even headed to all time highs. But I think there is a chance that we go back and try and fill the gap a little, maybe between 270-290. A kinda of backtest before really breaking out to the 380 level or higher. But we may reach the 320-340 zone first. Not willing to bet on it though. Just holding my shares. Will add if it dips.

Wut up homies?! Are we mooning yet? Where is @SpaceCash and @StealthP3D? Whose house is the party at this weekend? :cool::p:cool::p

All right, though seriously, I'm not popping the champagne yet. Nor willing to margin up or by LEAPS. But I have a good sized stock only position (with limited margin) and made some options money on the move up yesterday, which I converted to stock. I have no idea what the stock is going to do. Either I'm jaded or just confused. We've been here many times. It's a big move with a big gap, and we all know TSLA likes to fill the gaps, and there are even gaps below 250. But unlike previous times, I'm not convinced that this will go back down and fill. This was a major gap up, almost like a so-called "break away" gap, which could end up permanently trapping shorts below.

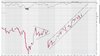
The stock is really behaving unusual IMO. If you look at the multi-year chart, you'll see that it bounced between approx 180-280 for years and then between 280-380 for some more years. It then had a technical break below 280 support this past spring. At this point, I expected it to either continue falling, or go back into its old range of 180-280, or make a V shape recovery. It now doesn't appear to be doing the former two, so the V shape recovery appears to be on the table. I stated previously that it would take either significant time or sig news to get back above the technical break of 280. The market has determined that this was that news. So this is what I'm hoping for, a V shaped rapid recovery with maybe a minor pullback and partial gap fill, and (eventually) new all time highs. With that said, I'm not willing to bet on it in leveraged fashion. Because we all know how TSLA can be. But to each, their own.

The other two possibilities I see are: that it's a head fake and we quickly fade back down back below into the 180-280 range. We will know whether this is true shortly. Or, second, that it forms a completely new pattern than before, where it freely moves between a new wider range between 180-380. That scenario would just royally suck IMO. As if it isn't bad enough that we had to bounce around in a 100 point range multiple times a year. 200 point range would just be hell. An example of this would be that it goes up to 320-340 (or even 380) and then goes all the way back down to 180 again. That would just suck, esp if you got leaps or other options (personally, if I bought Leaps at 180, I would liquidate them now and convert to shares, as it would just hurt too much to see those leaps come back to 180 -- been there, done that.) This is why I'm just holding shares. Yes, it takes longer till we get rewarded, but much less stress. I only give up opportunity cost and maybe minor margin interest expense.

Anyway, just some thoughts on the matter. Not advice. Good luck to all!
 
See my comment below in the main thread. It seems like we are back in the 300-380 range as you say, and perhaps even headed to all time highs. But I think there is a chance that we go back and try and fill the gap a little, maybe between 270-290. A kinda of backtest before really breaking out to the 380 level or higher. But we may reach the 320-340 zone first. Not willing to bet on it though. Just holding my shares. Will add if it dips.
That's my strategy add on the dips. If it goes to the high 200s add a bit more. Thanks @Antares Nebula . Good day for longs today. Monday should be interesting as I think the short covering will continue as there's bound to be more margin calls from today for #TSAQs
 
  • Like
Reactions: Antares Nebula