Here's another way to look at price volume (I eyeballed 20M as average daily volume). Its pretty much all aligned except for, notably, one small volume candle on May 1, where the daily chart is just a big red on 5/1 followed by a big green on 5/4. As a retail trading hack that tells me that someone(s) smarter than me closed out Friday May 1 with a bunch of accumulation around $700, and that suggests to me that $700 is going to be reasonably strong support. It also better aligns the two pre-corona peaks at $900, which I'd read as pretty strong resistance.


Welcome to Tesla Motors Club
Discuss Tesla's Model S, Model 3, Model X, Model Y, Cybertruck, Roadster and More.
Register
Install the app
How to install the app on iOS
You can install our site as a web app on your iOS device by utilizing the Add to Home Screen feature in Safari. Please see this thread for more details on this.
Note: This feature may not be available in some browsers.
-
Want to remove ads? Register an account and login to see fewer ads, and become a Supporting Member to remove almost all ads.
You are using an out of date browser. It may not display this or other websites correctly.
You should upgrade or use an alternative browser.
You should upgrade or use an alternative browser.
TSLA Technical Analysis
- Thread starter Robert.Boston
- Start date
-
- Tags
- elon is an ass TSLA
Piper Sandler technical strategist Craig Johnson was a regular guest of mine on my old TV show. He still sends me his newsletters. In early 2013 he recommended TSLA, which inspired me to buy my first shares at $38.
Today he did not comment on TSLA, although he had recommended it last month a couple of times. I subsequently doubled my position. His colleague Alexander Potter has it rated as a BUY.
However, this morning Craig did write this regarding the overall market:
In conclusion, U.S. equities have pulled back from overbought levels. Concerns over a second wave outbreak of COVID-19 and the Federal Reserve’s gloomy assessment of the road to recovery have thrown some cold water on the rally. Given the record-setting pace of the advance, and building economic uncertainty, pullbacks and volatility should be expected. However, we believe weakness should be bought as the technical and fundamental backdrop implies the lows have been set for stocks and the economy. We reiterate our year-end price objective on the SPX of 3,600.
Craig Johnson is a managing director and technical strategist at Piper Sandler (formerly Piper Jaffray). He was a regular guest of mine on my old TV show, and still sends me his newsletters. In early 2013 he recommended TSLA, which led to my first purchase at $38. His auto analyst colleague Alexander Potter has a BUY rating on TSLA.
This morning Craig included TSLA in his list of technically positive stocks, and noted that there may be an opportunity for investors to benefit from its recent pullback.
This morning Craig included TSLA in his list of technically positive stocks, and noted that there may be an opportunity for investors to benefit from its recent pullback.
Craig Johnson is a managing director and technical strategist at Piper Sandler (formerly Piper Jaffray). He was a regular guest of mine on my old TV show, and still sends me his newsletters. In early 2013 he recommended TSLA, which led to my first purchase at $38. His auto analyst colleague Alexander Potter has a BUY rating on TSLA.
This morning Craig included TSLA in his list of technically positive stocks, and noted that there may be an opportunity for investors to benefit from its recent pullback.
The above quote was from Monday. Here's what Craig wrote this morning, Wednesday:
• Tesla Inc (TSLA - $982.13); Shares have climbed to record-highs after surpassing resistance off the February ‘20 highs; above the rising 10-/30-week WMAs; constructive/confirming RS trend and notable TechniGrade ranking; add to positions, as we suspect shares have more room to run.
Technical analyst Tim Ord was a regular guest of mine on my old TV show. Below is what he wrote shortly after the close today regarding his latest opinion change for the S&P 500 ETF (SPX).
For monitoring purposes: Long SPX on 6/18/20 at 3115.34.
All the Best,
Tim Ord
Ord Oracle - Home
For monitoring purposes: Long SPX on 6/18/20 at 3115.34.
All the Best,
Tim Ord
Ord Oracle - Home
Craig Johnson is a managing director and technical strategist at Piper Sandler (formerly Piper Jaffray). He was a regular guest of mine on my old TV show, and still sends me his newsletters. In early 2013 he recommended TSLA, which led to my first purchase at $38. His auto analyst colleague Alexander Potter has a BUY rating on TSLA.
This morning in his monthly "Informed Investor" booklet, Craig noted that TSLA is his top choice among major auto manufacturers, and reiterated his Tesla comment from last week:
TSLA—Shares are trading in record-high territory after surpassing resistance off the February ’20 highs; above the rising 10-/30-week WMAs; constructive/confirming RS trend and impressive TechniGrade ranking; add to positions, as we suspect the stock has more room to run.
Last edited:
Artful Dodger
"Neko no me"
Trying to discuss the merits of technical analysis is similar to discussing the merits of astrology. It's exactly right sometimes, but so what? Please take this (and all TA) to the thread that is specifically meant for it. You know, like Curt is polite enough to do.
Why did you single me out for a reply in Main, instead of including the OP? What's wrong, is the "TA is BS" comment polite by your standards, but calling for reason isn't?
I expect little actual, fact-based discussion of the merits of TA since there have been only 7 posts here in this thread in 5 wks, only 2 of which were NOT by @Curt Renz and only 27 posts total in this Forum in all of Q2.
Yet you had to sneak in a side comment in Main comparing TA to Astrology? That's not impolite, that's borderline trolling. Bad judgement, IMO.
Astrology isn't a swear word like "BS", but it is disrespectful to compare obvious psuedo-science to T/A, which is a statistical and numerical methodolgy (albeit misunderstood or misused by some).
FYI, I will not reply to further emotion-based arguments. If people present actual evidence in support of their postions instead of inflammatory rhetoric, we can discuss this topic further. Otherwise, don't expect a reply from me.
Regards,
Lodger
Last edited:
Astrology isn't a swear word like "BS", but it is disrespectful to compare obvious psuedo-science to T/A, which is a statistical and numerical methodolgy (albeit misunderstood or misused by some)
Eh, I wouldn't take it too personally. Honestly, its nice to know who's opinion/analysis is worth considering.
If there's one thing most folks can agree on it is that any kind of trading/investing should be consistent, objective, and data driven, and explicitly not emotional...and any advice/opinion/analysis we consider should come from a trusted source rooted by the same logic. The corollary: Anyone lacking ability to objectively accept there are merits and drawbacks of both Technical and Fundamental strategies (to say nothing of tossing bonus insults in the mix) is obviously not objective enough to offer consistently worthwhile trading/investing advice, and thus all of their advice is worthless.
I often find that inconsistency is rooted in novice experience, insufficient market understanding, or even just a lost shirt or three, but the cause of the inconsistency is all but irrelevant since the bottom line to you is still the same.
Bet TSLA
Active Member
I'll note that you provide nothing to support your dismissal of astrology as perfectly legitimate. So where do you get off righteously demanding a "fact-based discussion of the merits of TA"? If anybody is being disrespectful it's you. I didn't condemn anything. I just asked that discussion be confined to its proper place.Why did you single me out for a reply in Main, instead of including the OP? What's wrong, is the "TA is BS" comment polite by your standards, but calling for reason isn't?
I expect little actual, fact-based discussion of the merits of TA since there have been only 7 posts here in this thread in 5 wks, only 2 of which were NOT by @Curt Renz and only 27 posts total in this Forum in all of Q2.
Yet you had to sneak in a side comment in Main comparing TA to Astrology? That's not impolite, that's borderline trolling. Bad judgement, IMO.
Astrology isn't a swear word like "BS", but it is disrespectful to compare obvious psuedo-science to T/A, which is a statistical and numerical methodolgy (albeit misunderstood or misused by some).
FYI, I will not reply to further emotion-based arguments. If people present actual evidence in support of their postions instead of inflammatory rhetoric, we can discuss this topic further. Otherwise, don't expect a reply from me.
Regards,
Lodger
I have no problem with you believing whatever you like. It's of no concern to me whether it's nonsense or otherwise.
Artful Dodger
"Neko no me"
Eh, I wouldn't take it too personally. Honestly, its nice to know who's opinion/analysis is worth considering.
If there's one thing most folks can agree on it is that any kind of trading/investing should be consistent, objective, and data driven, and explicitly not emotional...and any advice/opinion/analysis we consider should come from a trusted source rooted by the same logic. The corollary: Anyone lacking ability to objectively accept there are merits and drawbacks of both Technical and Fundamental strategies (to say nothing of tossing bonus insults in the mix) is obviously not objective enough to offer consistently worthwhile trading/investing advice, and thus all of their advice is worthless.
I often find that inconsistency is rooted in novice experience, insufficient market understanding, or even just a lost shirt or three, but the cause of the inconsistency is all but irrelevant since the bottom line to you is still the same.
Thank you for your sage words. Personally, I'm closing in on the mystical 10,000 hr mark in investing which many sources designate as the threshold for 'expertise'. Lol, I think for TSLA investing at least, I'm closing in on 'competence'. When I began this journey, I granted myself 10 years to get good at investing.
It has been a long slog with many dark days on the road to journeyman status, but I am now reaping the benefits of a reasoned and methodical investment strategy. Bonus, it's one I developed on my own from 1st principles, and thus is ideally suited to my experience, values, and goals.
It's been a good quarter, surprisingly enough. Forward!
Cheers!
Lodger
It could be that TA doesn’t work, it could be that it does. Fact is that thousands of investors base their decisions on TA patterns, making them a self-fulfilling prophecy. So even if TA doesn’t work (I think it does), the fact that so many act on it makes it very valuable.
I regularly study charts, especially candlesticks, and and often see that TA patterns have a predictive value. The strongest ones imho are:
- Trend lines that get broken (especially downwards), resulting in a substantial move.
- Trading ranges that are broken, resulting in a big move. Good example: TSLA breaking above the 380 range.
- Retesting of an outbreak. Good example: TSLA bouncing of the top of the old trading range in March.
- A ‘flag’ halfway through a move, indicating (when broken) that there’s another 50% move to go. This is one of the best predictive patterns I know.
- Shoulder-head-shoulder pattern. This can also be inverse. Possible example of this one: TSLA completed an inverse shs-pattern when it broke upwards through 850 in the second bull run. Price target is 1350 (based on the height of the head (850-350). Let’s see if that works out.
I think IBD buy and sell rules dictate that anything that busts out of a pattern for quick 20% gain mandate 8 week hold.
The 8 Week Hold Rule | Stock News & Stock Market Analysis - IBD.
The 8 Week Hold Rule | Stock News & Stock Market Analysis - IBD.
I thought about writing this down before, but I wanted to wait until the pattern was completed. It was yesterday.
After the meteoric rise of 490 points from 930 to 1420 the SP was starting to build what looked like a flag over the last few days. Such a pause pattern is usually formed half way through a move. Yesterday we broke out upwards, completing the flag. The goal has now become 1800 (bottom of the flag at 1310 + 490 points).
After the meteoric rise of 490 points from 930 to 1420 the SP was starting to build what looked like a flag over the last few days. Such a pause pattern is usually formed half way through a move. Yesterday we broke out upwards, completing the flag. The goal has now become 1800 (bottom of the flag at 1310 + 490 points).
vwman111
Member
I thought about writing this down before, but I wanted to wait until the pattern was completed. It was yesterday.
After the meteoric rise of 490 points from 930 to 1420 the SP was starting to build what looked like a flag over the last few days. Such a pause pattern is usually formed half way through a move. Yesterday we broke out upwards, completing the flag. The goal has now become 1800 (bottom of the flag at 1310 + 490 points).
Does the flag provide a timeframe?
Robertj
Member
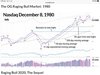
History may give an appreciation of what might happen
In 1980 the market dropped 25 % , this year Covid 33%
In 1980 it bottomed April and rose by July to hit its prior peak
and did not have a major correction until, small in September , bigger in October, and November
Is this where we are headed
In 1980 the market dropped 25 % , this year Covid 33%
In 1980 it bottomed April and rose by July to hit its prior peak
and did not have a major correction until, small in September , bigger in October, and November
Is this where we are headed
Attachments
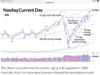
If price sticks at these ~$1680 levels, we'll end with a shooting star candle on the daily chart.
Seems like that formation should have an exception for when there is a $100 gap up on open.If price sticks at these ~$1680 levels, we'll end with a shooting star candle on the daily chart.
Similar threads
- Replies
- 21
- Views
- 6K
- Replies
- 4
- Views
- 355
- Replies
- 3
- Views
- 900
- Locked
- Replies
- 0
- Views
- 3K