Welcome to Tesla Motors Club
Discuss Tesla's Model S, Model 3, Model X, Model Y, Cybertruck, Roadster and More.
Register

TSLA Technical Analysis

This site may earn commission on affiliate links.
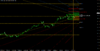
So I was bothered by the length of what I had identified as Wave 2 from April 2016 to Nov 2016. There were just too many waves to be a typical ABC pattern Wave 2. I circled the area on the chart below:
TSLAelliotwave12.jpg
As I read more about Wave Pattern, there is a phenomena called a Combination Wave Pattern (corrective). Basically Corrective waves can go longer due to a combination of different types of Corrective wave patterns. A simple way of thinking about it is an "extension" of Corrective waves created by linking (typically) different Corrective waves together.

The three main types of Corrective waves are: ZIGZAG, FLAT and TRIANGLES. They are also defined by their internal wave pattern/sequences. ZIGZAGs tend to have 3 waves, with an internal pattern of 5-3-5 sub-waves. FLATs also have 3 waves, but with a 3-3-5 sub-wave pattern. Finally TRIANGLEs often have 5 waves, but they are all 3-3-3-3-3.

When I looked at the sub-wave patterns, there were too many internal waves for it to be a consistent TRIANGLE pattern. So it must be a Combination type pattern. As I applied the rules I realized it is likely a combination of a FLAT pattern, followed by a ZIGZAG, as below:
TSLAelliotwave2.jpg
This fits things better.

What changes from a predictive perspective is that it means that our current Motive/Impulse wave pattern is Wave #1. Which is great for additional gains, but makes current predictions on price action more difficult.
 
  • Informative
Reactions: geneclean55
I have the impression that yesterday's close on the minute is looking pretty nice.
An hour before the solar roof announcement (website update and blog post) volatility dropped with a SP oscillating around $232, bollinger band getting pretty narrow.
Right after the news the SP seemed to be suddenly moving along an ascending trendline forming a ascending wedge with $325 as resistance right before close.
Any reason for a $325 resistance?
Any thoughts for the open tomorow and the next days?
 

Attachments

  • 2017-05-11-MinuteChartAscendingWedge.jpg
    2017-05-11-MinuteChartAscendingWedge.jpg
    271.3 KB · Views: 75
Last edited:
I'd like to mention that there is a reason this thread exists: it's to keep TA discussion out of the short-term thread.

As the author of McGraw-Hill's The Investor's Guide to Technical Analysis, I'd be more inclined to keep fundamental analysis out of the TSLA Market Action (short-term) thread. Fundamental analysis can be quite misleading, especially in the case of a company investing in rapid growth to disrupt long established capital intensive industries. Nevertheless I do try to restrict my technical analysis to this thread, and advise others to do the same.
 
As the author of McGraw-Hill's The Investor's Guide to Technical Analysis, I'd be more inclined to keep fundamental analysis out of the TSLA Market Action (short-term) thread. Fundamental analysis can be quite misleading, especially in the case of a company investing in rapid growth to disrupt long established capital intensive industries. Nevertheless I do try to restrict my technical analysis to this thread, and advise others to do the same.

As far as I'm concerned Curt, you can post your thoughts in any thread you want!:)
 
As far as I'm concerned Curt, you can post your thoughts in any thread you want!:)

Thanks, nevertheless I'll now place my latest post here. It's an excerpt from my commentary this evening on my website.
______________________

TSLA has surged for four sessions with increasing gains and trading volume, and daily lows near the openings and highs near the closes. That implies technical strength, and has resulted in a breakout from the trading range it had been in for the last eight weeks. During those weeks an Inverted Head & Shoulders pattern had formed, and punching sharply above the neckline on Tuesday could be construed as a bullish technical signal.
 
Last edited:
I'd like to mention that there is a reason this thread exists: it's to keep TA discussion out of the short-term thread.
I disagree with that!

The reason this thread exists is so that it's easier to find posts about TA.
As far as I'm concerned Curt, you can post your thoughts in any thread you want!:)
I agree with that!
 
I'd like to mention that there is a reason this thread exists: it's to keep TA discussion out of the short-term thread.

I believe that was the case with 2016 short term thread.

IIRC @AudubonB had set up two separate threads for that reason. The Market thread was to have all manner of the market (with TA included). The General thread was to have everything else, my interpretation was that it would have the fundamentals included there, news, and general discussion.

This was why there was initial discussion this year about including @Papafox's Trading Analysis thread in the Market thread, but this was quickly dropped to preserve the integrity of his thread. His thread has a great component of TA as well.
 
Thanks, nevertheless I'll now place my latest post here. It's an excerpt from my commentary this evening on my website.
______________________

TSLA has surged for four sessions with increasing gains and trading volume, and daily lows near the openings and highs near the closes. That implies technical strength, and has resulted in a breakout from the trading range it had been in for the last eight weeks. During those weeks an Inverted Head & Shoulders pattern had formed, and punching sharply above the neckline on Tuesday could be construed as a bullish technical signal.
Mate, I don't want to attack you, so please take this as advice, but that website is the first thing I've seen this side of 2005. You'd get better results running a live journal.
 
Upside target?

According to Bulkowski - Bulkowski's Head-and-Shoulders Bottoms

Neckline - $327.40
Head low - $290.80
Difference - $36.60
% meeting price target - 74%
= $27.08

Neck line - $327.40
= $354.84
That said, it's not really a "bottom", and under "Trends", he states "A short-term drop leading to the pattern results in the best postbreakout performance." - this is literally the opposite of our case. (Price rising into the pattern)

I'm using this as the rough median for the next consolidation range. Been riding a fair number of June $350c up from last week that I've started to convert in to spreads to lock profits - will probably do so for the remaining calls tomorrow, depending on price action and accumulators in the morning - the extremely strong accumulator charts from Friday showed definite weakening today, likely a combination of profit taking and short re-entry.