Welcome to Tesla Motors Club
Discuss Tesla's Model S, Model 3, Model X, Model Y, Cybertruck, Roadster and More.
Register

TSLA Technical Analysis

This site may earn commission on affiliate links.
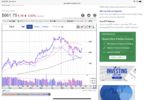
Technical analysis, price predictions and news on Tesla stock for week ending 03/13/2021. Tesla may have put in a bottom as it rallied higher this week. Technical indicators such as MACD and RSI both looking much more bullish. Bullish cross in the MACD with histogram turning positive. RSI continues to rally higher after breaking out of downtrend. All indications that momentum to the downside has subsided. Bull case price target is the 50DMA currently at $776. A break above this and next major resistance is at $830. To the downside, a break below support at $670 will trigger potential further drop to $575 support.

Tesla news this week includes:
  • FSD Beta will be more widely available to download for Tesla owners
  • Tesla Model 3 demand spikes in Japan following 25% price slash
  • Tesla is slowly losing its electric-vehicle crown as Ford’s Mustang Mach-E cuts into sales
  • Cathie Wood: Our confidence in Tesla has gone up, New TSLA price target in 1-2 weeks
  • Tesla China sold 18.3K China made Model 3/Y in Feb, an impressive 18% growth vs January
  • Tesla pays lowest average price for battery cells and expected hold advantage through 2030
  • Rideshare vehicle provider, EVmo, to acquire fleet of Tesla EVs

 
  • Helpful
Reactions: Sudre
Probably a good idea. For those that didn't lookup Spruce Point Capital Management, LLC:

I disagree but welcome your financial proof. Show your account balance, share your trading thoughts, show trades. I don't think it is a time to be a short term trader using TA.

Show me anyone using TA to get the greatest results, the folks I would consider following would avoid this for a long time. It needs to set up again. It needs rest. There are likely other stocks to rotate into play.

I measure volatility using a 14 day ATR, TSLA has been at an all time high with regards to volatility. This suggests safe bets are small bets. Wild swings kill accounts. I don't think there are swing traders killing it now.
I've been writing puts, but they've been assigned over the last month, so I've been paying more closer attention to TA and looking to BTC, QQQ and VIX to show how much positive sentiment is in tech. I've been getting a ton of value out of this Youtube channel:

I've been holding off on more options trading until I can more clearly see what is happening.
 
  • Like
Reactions: 2virgule5
I'm seeing a bull flag that predicts a break to the upside in the next couple of trading days. Unfortunately, that coincides with a daily TD Sequential 9 sell, so not trading it myself. If I was forced to make a trade, I'd be buying, but that's just the default on TSLA ;)
 
Okay self proclaimed technicians, what are you seeing?

First, take it easy with the snark.


As contemplated in this post, price did indeed find support at 200MA and the uptrend line from August (its truncated to Nov in the screenshot below just to make things easier to view).

Obviously we've been consolidating for the past 7 days, and as noted above we have a bull flag going on right now. I'd look for 200MA and the uptrend to continue to provide support on the consolidation and the top of the flag to provide resistance. Ideally we consolidate for a few more days and the triangle described above (as opposed to the flag) enables a pro gap signal. A bit Captain Obvious here, but I'd be wary of a weak exit from the consolidation.

Note that I've drawn the consolidation lines all the way back to late Feb instead of just as a more traditional flag. I think that's a pretty significant factor, as the additional action in the ~650-725 range bolsters any thesis of this being a price range of significance. Most probable IMHO is upward movement from here; obviously a keen eye must be paid to the macro side of things. ES, for instance, is basically ATHing right now.

On the upside we could run up to high 700's, on the downside back down to mid 500's.

1616083754927.png


Switching over to a 17M share candle (~1/2 of TSLA daily average) the most interesting highlight is the volume down in the ~560-600 range. There's a TON of volume going on down there which should provide very strong support, and stronger than the recent low of ~540.

1616083492572.png


I'm still in the camp of TSLA chart is busted up and will be back and forth base building or consolidating for a while.

This simply doesn't make sense--there's nothing to 'bust up' in technical analysis. It is simply an exercise in pattern recognition and corollary probability that, when applied correctly on top of a bigger picture strategy that includes things like risk mitigation and position sizing, is right enough to result in a winning account balance. Technical analysis never breaks, it simply doesn't always work.
 
Technical analysis, price predictions and news on Tesla stock for week ending 03/20/2021. Tesla falls lower this week, however, it could be forming the right shoulder of an inverse head and shoulders which is a bullish formation in technical analysis. Tesla could possibly be setting up to complete formation of the right shoulder next week if it can break above $657 then work its way back up to the neckline at $695. A break above this would confirm completion of a successful inverse head and shoulders and could be headed up to test the next resistance level at $771. To the downside, if the inverse head and shoulders fails, Tesla could be headed down to retest support at $575. A break below that would lead to high probability of testing the 200DMA at $499.

 
Strong support today on a spike in volume at $600 may have been quite significant for TSLA. Just as it did earlier this month, the 150-day simple moving average proved supportive. The algobots follow such basic technical signs, whether you do or not.
 
Technical analysis, price predictions and news on Tesla stock for week ending 03/27/2021. Tesla failed to complete the inverse head and shoulders formation this week. Instead it pulled back to retest a major uptrend support line. If Tesla can hold this uptrend, then it can run back up to resistance at around $645. If it can break above that, the next resistance comes in at the 50DMA at $751. On the bear side, I don’t see much room to the downside from here. If it breaks the key uptrend line then the next major support would be the 200DMA at around $511. It is highly unlikely that Tesla will break below this level unless something catastrophic happens.

Tesla news this week includes:
  • Elon Musk deletes tweet stating Tesla will be most valuable company within a few months!?
  • ARK Invest has $3,000 updated base case price target for Tesla by 2025
  • Tesla now accepts Bitcoin as payment option
  • Elon Musk: FSD subscription coming in 6 weeks; Chance to deliver 1 million cars this year
  • Tesla to possibly open Supercharger network for non-Tesla EVs
  • Tesla to deliver 15 semi trucks to Pepsi this year
 
Technical analysis, price predictions and news on Tesla stock for week ending 04/03/2021. Tesla still needs to confirm trend reversal with a break above $700, but it’s bullish price movement this week looks promising. To the bull side, $700 is key resistance level and a break above that would and we could easily see $736-$750. To the downside we have support at $630-$640, but if it breaks below that we could retest support at around $590. Given the outstanding Q1 2021 delivery numbers while markets were closed on Friday, we could very well see a huge run up in Tesla stock on Monday morning. Don’t write off the possibility of it surging past $750 either!

Tesla news this week includes:
  • Tesla and Toyota working on joint project involving a compact SUV?
  • Tesla looking to make 5 semi trucks per week in Nevada
  • Volkswagen to buy credits from Tesla in China to comply with environmental rules
  • Apple to buy over $50 million worth of batteries from Tesla for new energy storage project
  • Tesla delivers whopping 184,800 vehicles in 1Q 2021 despite obstacles
 
Is a Head & Shoulders pattern always bearish?

Looking at the chart, I see pretty clear left and right shoulders in the 600 to 700 range. I've always heard head-and-shoulders referred to in the negative, but if I didn't hear that, I'd just look at 600 as a support level. What do you all think?
 
i find an understanding of so called chart patterns comes over time, through observation, and understanding more of the psychology of the stock, sector, overall market.

so if asking questions about h and s, or inverted h and s, perhaps think about the psychology behind things, get that right. Don’t blindly trade based upon shapes.

if patterns are obvious to all, all can be taken advantage of by those smarter and better equipped.

id also say anyone actually asking questions or thinking of asking questions should recognize some measure of ignorance and trade lightly. If you are asking you do not know what is going on. Watch, listen, journal, dialog.

I find the pattern or price being all over the map as hard to trade. Compare to tight price action in November, which should or could have been easier to trade with conviction. Tight tight tighter on declining volume
 

Attachments

  • 0D065795-3F3F-406F-BB03-7FD64CE5A557.png
    0D065795-3F3F-406F-BB03-7FD64CE5A557.png
    957.5 KB · Views: 53
Is a Head & Shoulders pattern always bearish?

As a pattern, yes (obviously, an inverted H&S is bearish). When a third peak can't make it as high as the second peak (but rather, only as high as the first peak), that indicates there's not enough conviction in the market. Its like missing that last rep at the gym.

Obviously no one indicator tells the whole story, and you should find some comfortable mix of indicators to enhance your own personal brand of analysis.
 
  • Like
Reactions: ReddyLeaf
You know how sometimes you draw on a chart after the fact and are like "damn, I wish I traded that but its all good"? And then other times you can't believe you missed the obvious telegraph?

The early March bottom in the mid 500's is the latter. :mad:

Anyway, we're fixin on potentially an ascending triangle in the short timeframe and a symmetrical in the mid timeframe, both using the same uptrend TL. If we break the ascending quickly we may see a run up to the high 700's, but I'd bet that the symmetrical will hold. If the ascending holds over the next day or three then I see price testing the uptrend, down in the low 600's.

1617642289340.png