


Moderator comment - initial posts moved from Made in China Model 3: Build Quality / Hardware Differences
 teslamotorsclub.com
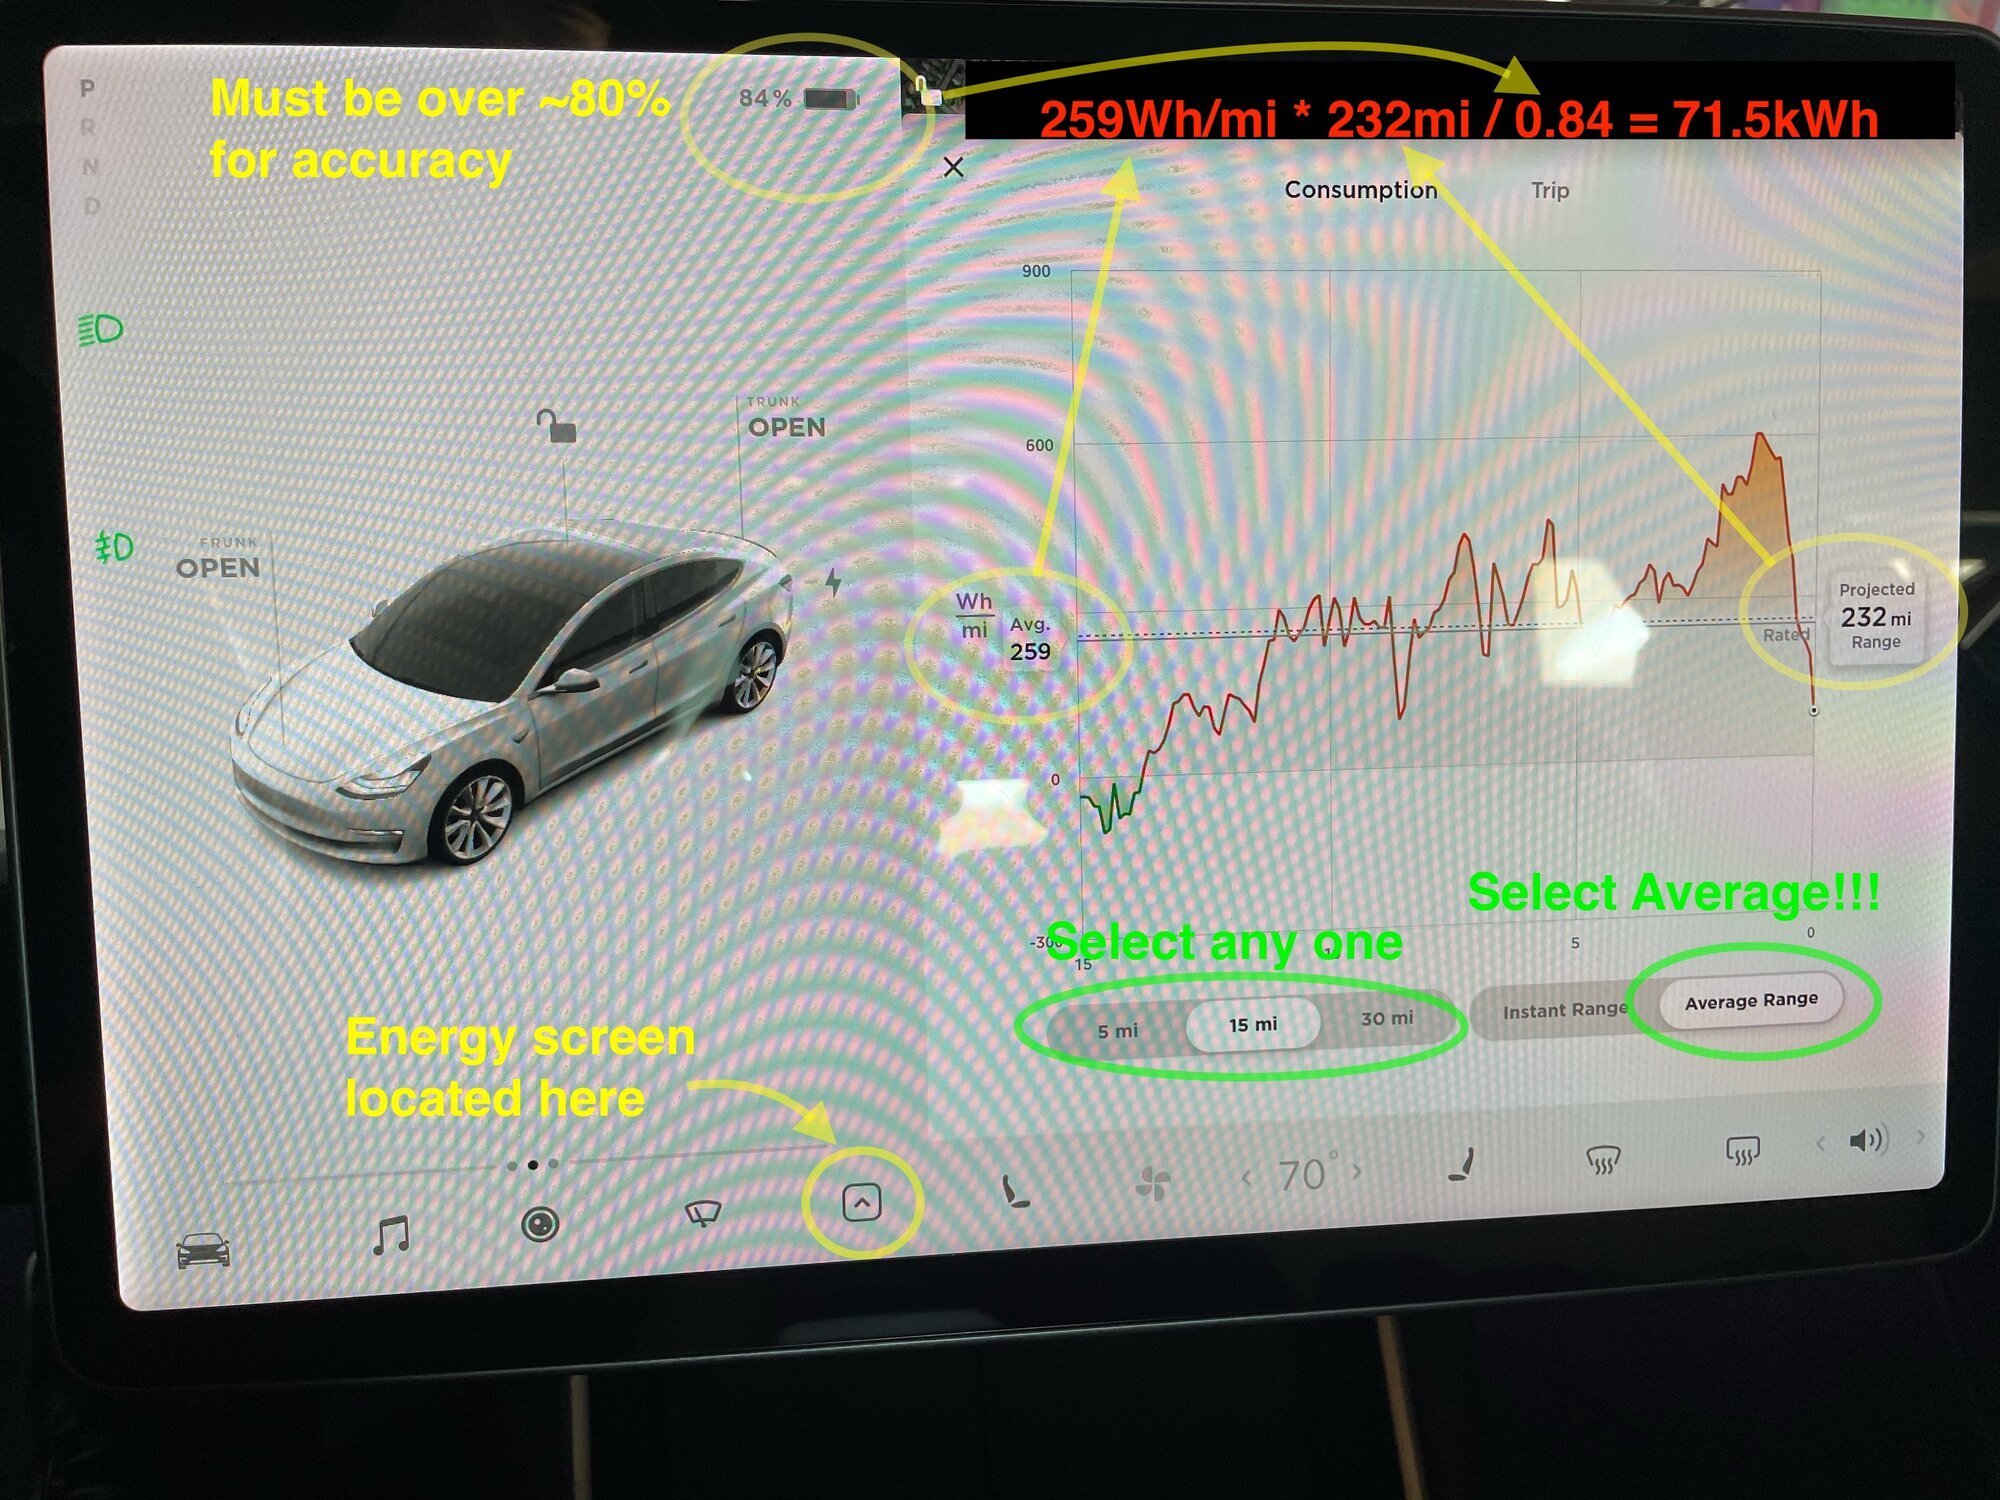
Calculating Your Battery's Estimated Capacity Using the Car's Energy Screen
Re posting here and making this a sticky post so it doesnt get lost. @AlanSubie4Life originally posted: =========================================== (originally posted by @AlanSubie4Life. Original thread this appeared in can be found here: ( 2021 model Y scan my Tesla battery size)...
teslamotorsclub.com
Last edited:
