Welcome to Tesla Motors Club
Discuss Tesla's Model S, Model 3, Model X, Model Y, Cybertruck, Roadster and More.
Register

Using TM-Spy for iOS

This site may earn commission on affiliate links.
Perhaps while busy Gathering Data, the app is in, or should be in, a do not disturb mode?

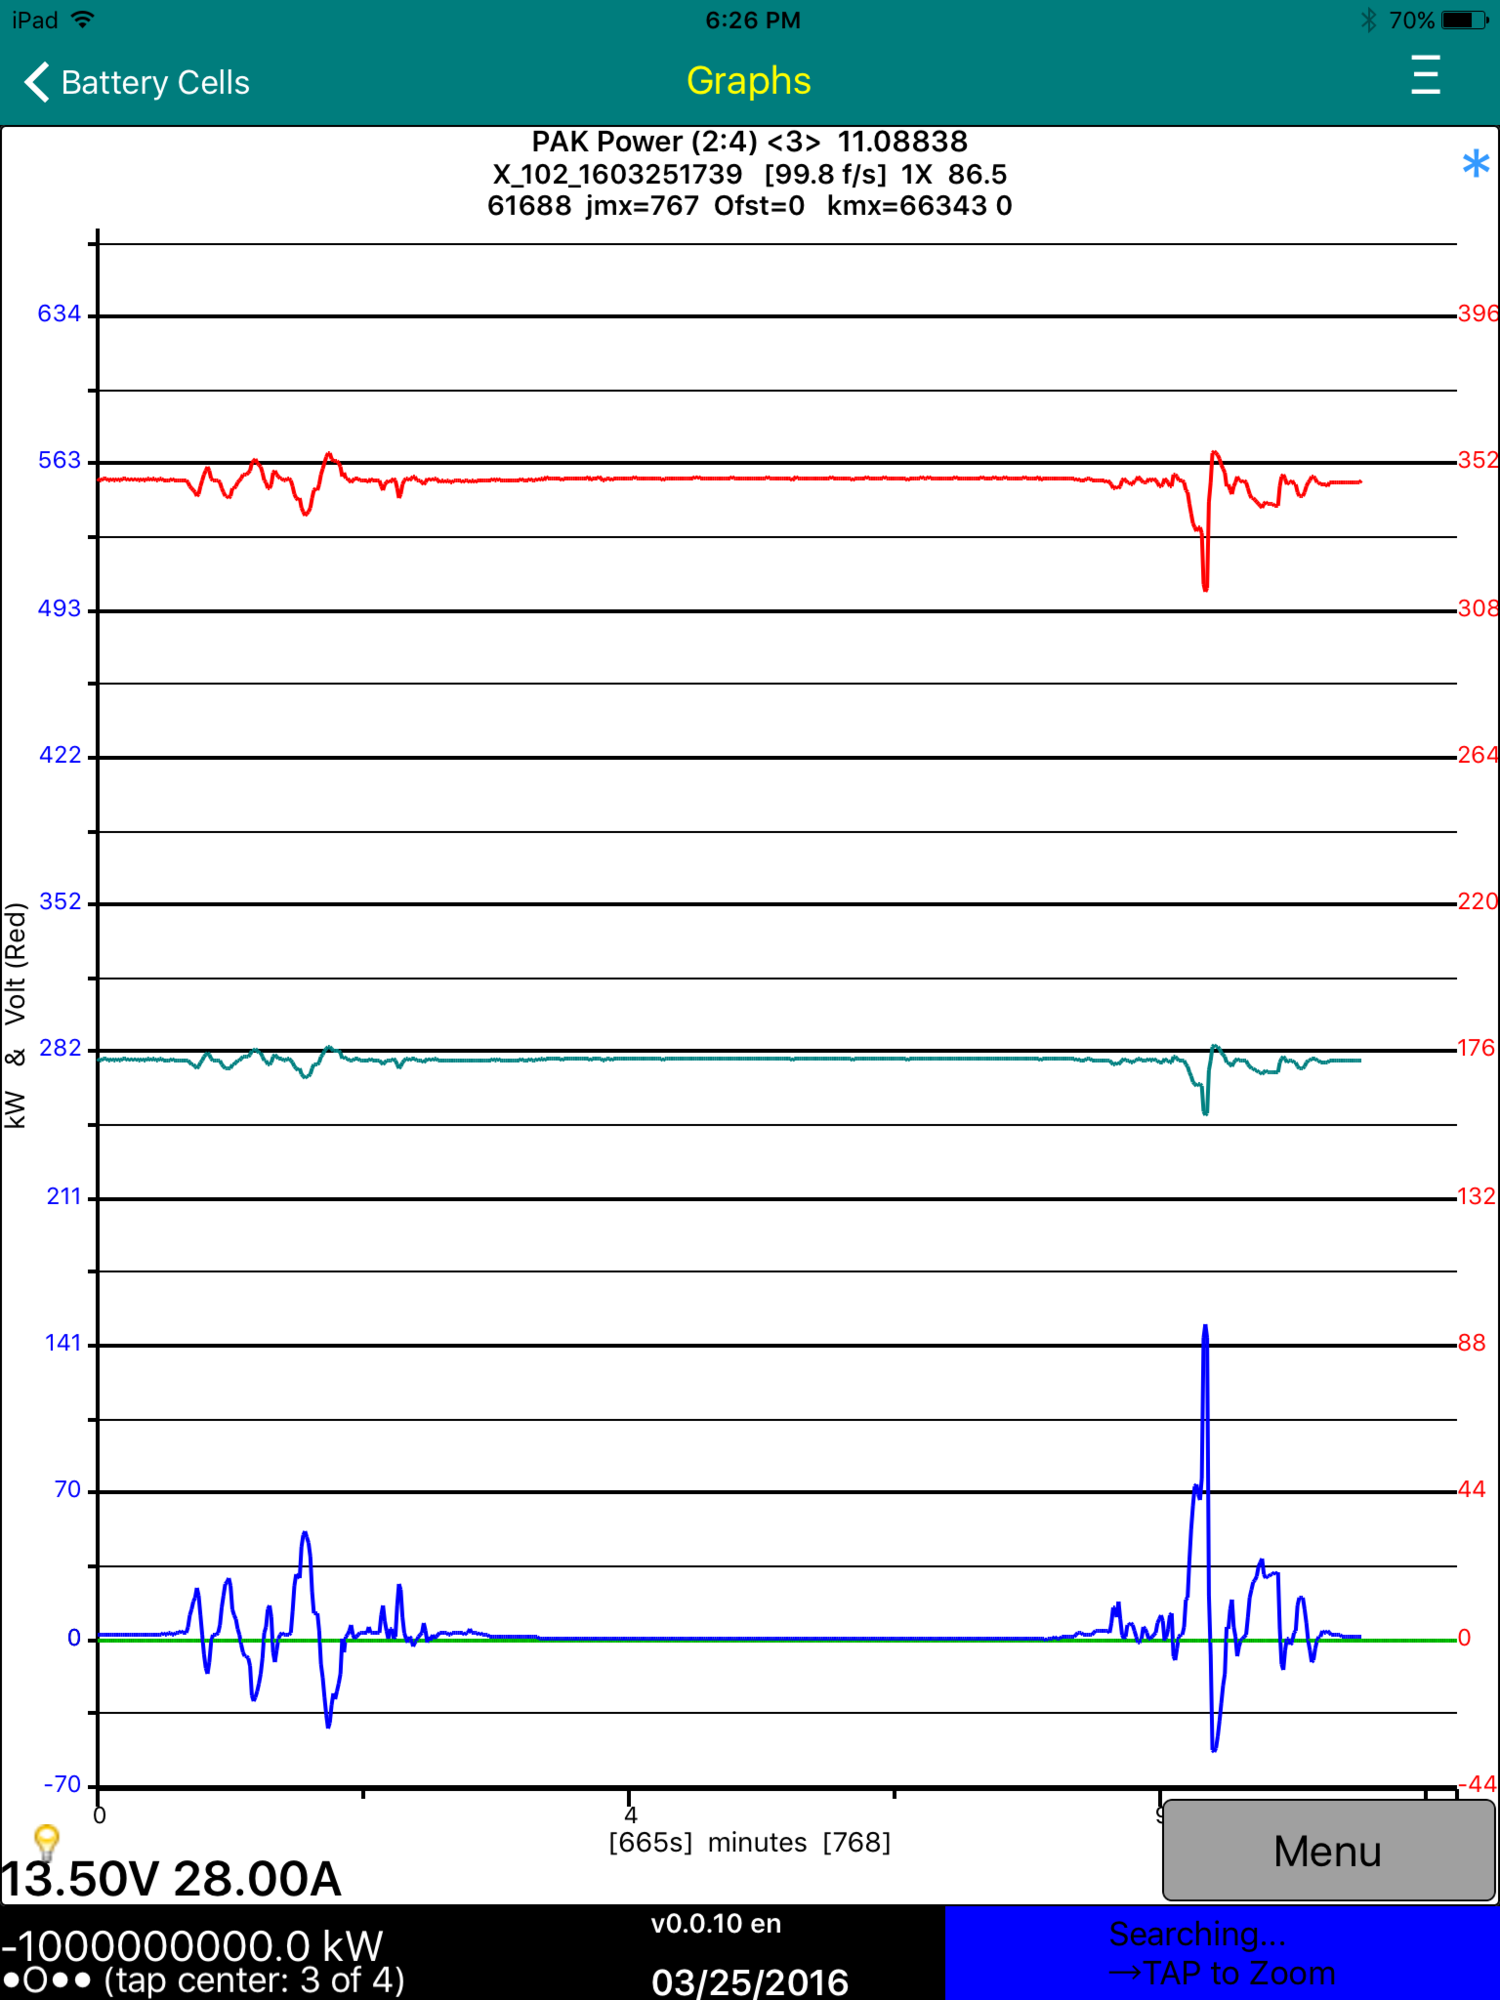
With no disturbances, my iPod Gathered Data nicely with v0.0.9 and graphed the data with v0.0.10 ... the app seemed to keep the iPad alive while Gathering Data. The bug in zero-based graph style when doing a 3-variable plot seems to be eradicated, as seen below.

image.png


The middle line is green, representing half-voltage.
Thanks Jim.
 
Trying to test the use of User Plot definitions, which appear to work rather well, except for one wrinkle seen in scaling the blue line below. I reported it to Turbo3 and he says that it will get fixed in the next version.

In using the Plot Product feature, the first and second variables of the Plot definition are used, and the first variable must be the one that might go negative, like Amps. The second variable should stay positive, like the pack Volts. Jim's rules, at least for now.

The (2:4) <3> indicates that this Plot uses lines 2 through 4 of the User Plot file, and that it is a 3-Recipe Plot. The first line of the User Plot file is the text of the spreadsheet column headers.

I inserted a copy of my User Plot file's line 3 as line 4, changing the volts scaling factor from 0.01 to 0.005 to show V/2 (half-volts) as the 3rd variable. In the FullScale Graph style, it works, as seen in the first pic below. However, the other two styles get confused, apparently just using the last plot variable for scaling.
But, in any case, a pleasant surprise, finding an unreleased feature, I suspect. Way cool, Jim.

You have "busted your hump" to get the Data Collection feature out to us, so now please take time to do those accumulated house chores, and other SWMBO stuff. I keep playing with this stuff, and learning to use iOS and Dropbox with a text editor for the csv files (how do others do this?), but I really should try to finish taxes first. So, taxes, then data collection.

Great cheers for you, Jim.

Plot of 3 variables from one msgID:
View attachment 168588

But, three variables still needs work:
View attachment 168589

Cheers, Gary
Here is the fix for this one. Now all three three plot graph types plot correctly. Only a two character change to fix this one. ("=2" to ">1").
IMG_0195.PNG
IMG_0196.PNG
IMG_0197.PNG
 
Turbo3.
In your three screenshots above, the last shows the first variable as blue amps or power, the second as red volts, and the third as green half-volts.

The top two still show the first variable as blue, but the second volts is shown in green ... at least the scale would indicate the volts, rather than the half-volts.
So, maybe you plotted the 2nd variable in red, with the red scale, but then plotted the 3rd variable, to a different auto-scale which is not shown, which then exactly covers the red due to the auto-scaling of the green?

But, great work anyway.
 
When displaying all three plots with auto scaling the 1 volt and 1/2 volts will expand to the same plot since they are the same data and overlay exactly. That means you only see the last one drawn which is the green one. The right hand scale is only for the over written and unseen Red plot. The same thing will happen if you graph 2,3 or 4 plots of exactly the same data. You will only see the last one plotted.

I could try making the colors a bit transparent and see what that looks like.

Version 0.0.11 is out and everyone should update to it to avoid the crashes seen on earlier versions.
 
In zooming in and out, a factor of 1.5 is used in v0.0.11 but probably 2.0 would be sufficient, and perhaps take less taps to use, and might be easier for the user to read the "x" factor.

Nice having Reset available after zooming, but Reset Time Scale or just Full Time Scale or some such would be easier to understand. Initially I thought that Reset might mean erase my collected data ... before I had a chance to Save it.

I will try a Plot with 3 and 4 variables, with different data for each.
 
When displaying all three plots with auto scaling the 1 volt and 1/2 volts will expand to the same plot since they are the same data and overlay exactly. That means you only see the last one drawn which is the green one. The right hand scale is only for the over written and unseen Red plot. The same thing will happen if you graph 2,3 or 4 plots of exactly the same data. You will only see the last one plotted.

I could try making the colors a bit transparent and see what that looks like.

Version 0.0.11 is out and everyone should update to it to avoid the crashes seen on earlier versions.

I downloaded 0.0.11, and looking better and better - but I still crash on screen 3 as above.
 
I found a factor of 2 too coarse so changed it to 1.5.

I have made plot colors 2 and 3 a little transparent but of course you still end up with just a single line. It just has a mix of plot 2 and 3 colors. That is probably good enough as this is a corner case.
 
Found a bug you need to avoid until the next release.

When taking a trace you can be on graph screen 3 and when you tap the menu key you will be allowed to save the active trace. DON'T DO IT.

You must stop a trace by going to graph screen 4 and pressing the Stop Rec button first.

If you save an active trace while on graph screen 3 it will not have the ending time stamp and will crash the app when you try to read it in again.

Next version will handle traces saved this way but will need to assume a 100 f/s sample rate since the end stamp was not saved. It will also not give you the Save option on graph screen 3 until the trace is stopped.
 
Zoom Factor of 1.5 is Ok, but it could be a future choice in Settings.

Plots with 4 different variables below, but I might have accidently defined the Plot with two different msgIDs. I will check, fix, and try again. Yes, I had some msgIDs wrong, fixed them, but get the same graphs. So, it appears that only the msgID in the first recipe of the Plot is actually used.

First, all 4 show up in the Auto-Scale graph type.
Maybe a tap on the left axis could alternate to show the green scale numbers,
and a tap on the right alternate between red and purple scale?

image.png


The Split-Screen graph seems to auto scale the red and green in the top half, but the purple seems to be missing.

image.png


The Full-Scale graph might show the green on the green zero line, but i would expect it to clobber the blue, but it does not ... so maybe missing. The purple seems to be missing.

image.png


This app is really getting better, almost every day, sometimes "sooner".
Yes, I sent the User Plot file to Turbo3.
Cheers, Gary
 
Last edited:
View attachment 168629 Using 0.0.10, I can't see the 3rd page-going down from here or up from page 2- the app crashes-
Any chance you remember what was on graph screen 3? Was it a previous trace you had taken. If so or you think it was then I would need to get that trace X_ file or files if you don't know which one.

If you are using Dropbox so all your X_ files are saved on Dropbox you can try using iTunes to rename the files by changeing X_ to Y_ so the app can not read it in. Or erase them all since you have them saved on Dropbox. If the problem goes away then you can put them back until you find the one causing the problem. That is the one I need to see.
I don't know what was on screen 3.
I started using dropbox after the problem started, but just copied itunes files into dropbox "itunes from failed screen 3", and you should have access. I'll see if I can find the bad file.
 
I don't know what was on screen 3.
I started using dropbox after the problem started, but just copied itunes files into dropbox "itunes from failed screen 3", and you should have access. I'll see if I can find the bad file.


Doesn't look like a file is causing the problem.
I used itunes to delete tm-spy files,
synched itunes and phone,
deleted tm-spy from phone,
reinstalled tm-spy on phone,
and still crash on screen 3.