Welcome to Tesla Motors Club
Discuss Tesla's Model S, Model 3, Model X, Model Y, Cybertruck, Roadster and More.
Register

Waymo

This site may earn commission on affiliate links.
Just quickly downloading and analyzing the California DMV disengagement reports for 2021 here: Disengagement Reports - California DMV

I don't think we can draw any conclusions in either direction. But I put some effort into this so I might as well share the graphs. Ultimately the data just isn't detailed enough to really dig into it very far.

First, miles per disengagement are indeed increasing as total miles are driven.

View attachment 786748

And the image is somewhat more interesting when you break it down by VIN. On average, Waymo reported 47,964 miles per disengagement for November 2021 on average, but the worst vehicle in the fleet drove 440 miles before its first disengagement that month, while the best vehicle in the fleet drove 3,344 miles without a single disengagement that month. (Points at the top of the chart represent Inf miles per disengagement).

View attachment 786747

It's a pretty extreme variance in disengagements per vehicle. So they could have a steady fleet of consumer-facing vehicles which they keep to a limited number of streets to keep public disengagements down, and a more disengagement-heavy testing fleet. Here's how that non-disengagement fleet has grown over the year:

View attachment 786752

And for the most part, miles driven is positively correlated with disengagements. Although if you plot all the VIN-months out in boxplots, it recognizes all of those 0 disengagement/high-mileage months as outliers:

View attachment 786753

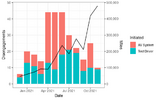
And then I thought it would be interesting to break disengagements per month down into whether the disengagement was initiated by a safety-driver or by the Waymo-driver. And note, in this data, Waymo did not report a single disengagement from a driverless vehicle. So in all of these cases a safety-driver was behind the wheel:

View attachment 786745

That spike in system-initiated disengagements from April to June is a little odd. Would be interesting to see if that correlates with any expansion in the geofence, but for now it seems unexplained why it rose so dramatically and then dropped back, when driver-based disengagements stayed relatively steady.

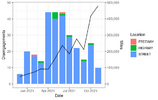
And then lastly I'll just point out how lacking the data is on road type. They don't break miles down into Street/Freeway/Highway, but they do break disengagements down by that, so this is the best view we have of that slice:

View attachment 786744

Might be tempting to say the April-June disengagement spike was caused by Waymo testing more freeways and highways, but we can't really tell because we don't have miles per road type, just disengagements.

WOW!!! Thanks for putting in all that work to create such informative and detailed graphs and really breaking down the data!!

A few observations:

The high system initiated disengagements might be caused by Waymo testing the 5th Gen. If you look at the disengagements by cause, Waymo did experience a lot of disengagements caused by "system diagnostic" type warnings. Remember that 2021 was the year, Waymo really focused heavily on validating the 5th Gen hardware & software.

Waymo has to report miles and disengagements from all their autonomous vehicles. So the data will include all their autonomous driving, both the internal testing and the trusted tester program. It is possible the trusted tester program may have skewed the disengagement rate since Waymo is more cautious with public rides.

It is not surprising that most of Waymo's miles are city miles, with very few highway miles, since Waymo is focused primarily on their ride-hailing service in SF which is primarily on city streets.

Waymo says that they are ready to remove the safety driver in SF. So this would suggest that Waymo has achieved a disengagement rate good enough in that geofenced area in SF. Waymo would not remove the safety driver unless the Waymo Driver met a very strict standard based on their safety methodology. It would also make sense if we look at your first graph, where Waymo had a disengagement rate of nearly 50,000 miles per disengagement in Nov 21 when they were doing almost 500,000 miles per month. These miles are probably the trusted tester program in the geofenced area. So in that geofenced area, Waymo was doing nearly 50,000 miles per disengagement in Nov, perhaps even better in early 2022. They got the Waymo Driver to be good enough for driverless in that limited ODD.
 
Last edited:
WOW!!! Thanks for putting in all that work to create such informative and detailed graphs and really breaking down the data!!

No worries. I wish we could have more discussions based on the data, but like I said, I think this particular data could be read any which way! Ideally, I would love more geospatial data from the California DMV. Something like road vectors with the number of hours driven per road per month would be great.

Also just spotted the second Y-axis (miles) was off on the second two charts, but it was too late to edit, so here are those two with a corrected scale:

corrected1.pngcorrected2.png
 
  • Like
Reactions: diplomat33
Ideally, I would love more geospatial data from the California DMV. Something like road vectors with the number of hours driven per road per month would be great.

Oh yes, I wish we could have more data driven discussions too. And yes, more geospatial data would be great. I would love it if disengagements were tagged on a map with a timestamp so we could see where and when the disengagements happened. The location with time coupled with the disengagement cause would be very helpful in interpreting the disengagements.
 
No worries. I wish we could have more discussions based on the data, but like I said, I think this particular data could be read any which way! Ideally, I would love more geospatial data from the California DMV. Something like road vectors with the number of hours driven per road per month would be great.
I'm sure they don't want to give a lot of information about their actual driving to competitors. Companies and the public (actually in this case enthusiasts) have opposite goals.
 
  • Like
Reactions: willow_hiller
Drive from suburbs to the airport.
FSD Beta stack doesn't even cover highways. The amount of double standard that is always implored is simply amazing
Forget NYC, they aren't even driving in actual profitable areas of SF. Their geofence is outside the densest Uber drives in SF.

Waymo in SF covers over 70% of SF and over 50% of daily trips. If it was the other way around you will be complaining that they only cover tiny percentage (25%) of SF.
There's no winning or logic with you people. Its pure double standard galore. While Tesla of-course covers nothing.
CKqrDgo.png


Funny thing is the “dense urban” parts of SanFrancisco that Waymo is not yet ready to cover - WholeMars drives with not that many issues ;)
That's funny because in alot of Omars videos you clearly see a Waymo. Just because Waymo isn't launching in a specific part of SF doesn't mean they are not testing there. Example is china town.

Funny you wouldn't use this same logic on Tesla...

So, you are saying they can match Tesla in "dense urban" traffic ;)

Just like in Chandler, even though they lost the "race" ...
Why can't Tesla match Waymo in independently verifiable driverless robotaxi?
 
And the image is somewhat more interesting when you break it down by VIN. On average, Waymo reported 47,964 miles per disengagement for November 2021 on average, but the worst vehicle in the fleet drove 440 miles before its first disengagement that month, while the best vehicle in the fleet drove 3,344 miles without a single disengagement that month. (Points at the top of the chart represent Inf miles per disengagement).

View attachment 786747

It's a pretty extreme variance in disengagements per vehicle. So they could have a steady fleet of consumer-facing vehicles which they keep to a limited number of streets to keep public disengagements down, and a more disengagement-heavy testing fleet. Here's how that non-disengagement fleet has grown over the year:
Its quite simple. There's variance in the actual environment being tested. some streets are easier and others are harder.
This is why when they deploy, they deploy to a geofence area with good disengagement rate not to every area that they are testing in.

For example cruise launching at night because they have goood data on the disengagement rate at night.
That spike in system-initiated disengagements from April to June is a little odd. Would be interesting to see if that correlates with any expansion in the geofence, but for now it seems unexplained why it rose so dramatically and then dropped back, when driver-based disengagements stayed relatively steady.

And then lastly I'll just point out how lacking the data is on road type. They don't break miles down into Street/Freeway/Highway, but they do break disengagements down by that, so this is the best view we have of that slice:

View attachment 786744

Might be tempting to say the April-June disengagement spike was caused by Waymo testing more freeways and highways, but we can't really tell because we don't have miles per road type, just disengagements.

I think they talked about it being because of integrating the new Gen 5 hardware.
 
  • Like
Reactions: diplomat33
Here's a cross-company comparison from the California DMV data. On annual average miles per disengagement, Waymo ranks 8th:

View attachment 786942

Personally I haven't heard much about AutoX, DiDi, WeRide, or Deeproute. All Chinese companies, I think.

It should be noted that some of these companies did far fewer miles than Waymo. I think AutoX only did 50k annual miles. So they did 50k miles and had 1 disengagement. Statistically, that is a small sample with a big error rate. By comparison, Waymo did almost 3M miles.
 
It should be noted that some of these companies did far fewer miles than Waymo. I think AutoX only did 50k annual miles. So they did 50k miles and had 1 disengagement. Statistically, that is a small sample with a big error rate. By comparison, Waymo did almost 3M miles.

Correct. When you sort by miles, the better-known players float to the top:

1648471510343.png
 
  • Like
Reactions: diplomat33
Correct. When you sort by miles, the better-known players float to the top:

View attachment 786944

Personally, I think number of miles matters a lot. For one, it shows an ability to scale because it shows you can do a lot of miles. Second, it gives us a bigger sample. A bigger sample will mean the disengagement rate will be more accurate since it reflects more scenarios that the car encountered. For me, more miles means the company is a more serious player.
 
FSD Beta stack doesn't even cover highways. The amount of double standard that is always implored is simply amazing
LOL. NOA is better than FSD Beta.

Next.

Waymo in SF covers over 70% of SF and over 50% of daily trips. If it was the other way around you will be complaining that they only cover tiny percentage (25%) of SF.
There's no winning or logic with you people. Its pure double standard galore. While Tesla of-course covers nothing.
Simple. Just deploy entire SF. Is there a reason for not deploying in entire SF - they have been testing since before my kids were born !

That's funny because in alot of Omars videos you clearly see a Waymo. Just because Waymo isn't launching in a specific part of SF doesn't mean they are not testing there. Example is china town.

Funny you wouldn't use this same logic on Tesla...
Yes _ I see Waymo all over the place near my house. Its so funny, its hilarious !

Why can't Tesla match Waymo in independently verifiable driverless robotaxi?
Why can't you start your own forum to crib about Tesla ?
 
Last edited:
It should be noted that some of these companies did far fewer miles than Waymo. I think AutoX only did 50k annual miles. So they did 50k miles and had 1 disengagement. Statistically, that is a small sample with a big error rate. By comparison, Waymo did almost 3M miles.
As usual, without knowing where exactly they are driving it is difficult to make any judgements.

For eg., if AutoX did most of the driving in "dense urban" SF and LA - they would be very impressive. If they just drove in far away suburb, its a different matter (though still impressive, but with lower confidence).
 
  • Like
Reactions: willow_hiller
The ride-hailing in Chandler has crossed 500k autonomous miles with no safety driver:

Roughly 1000 miles per day. That's 100 trips, assuming 5 revenue miles + 5 deadhead miles per trip. Waymo previously said their cars could provide 50 trips per day. So they have 2 taxis worth of business in Chandler. Except they use 5-10 vehicles to keep wait times down.
 
  • Informative
Reactions: EVNow
Roughly 1000 miles per day. That's 100 trips, assuming 5 revenue miles + 5 deadhead miles per trip. Waymo previously said their cars could provide 50 trips per day. So they have 2 taxis worth of business in Chandler. Except they use 5-10 vehicles to keep wait times down.
Waymo is looking more and more like one of those dot com companies with no real plan on how to get to profitability.

Without all that Monopoly money, they would have gone belly up by now.

Or May developed a real business plan.
 
  • Disagree
Reactions: diplomat33
Waymo is looking more and more like one of those dot com companies with no real plan on how to get to profitability.

Without all that Monopoly money, they would have gone belly up by now.

Or May developed a real business plan.
Roughly 1000 miles per day. That's 100 trips, assuming 5 revenue miles + 5 deadhead miles per trip. Waymo previously said their cars could provide 50 trips per day. So they have 2 taxis worth of business in Chandler. Except they use 5-10 vehicles to keep wait times down.

This is a strawman. Chandler is about learning how to operate a driverless service. Dolgov says so:


So Waymo is using Chandler to learn how to do driverless ride-hailing, not just the FSD part, but also the customer service part, the roadside assistance part, the wait time part etc... With 500k of driverless miles, Waymo has gained a lot more experience. This experience is key to scaling a driverless ride-hailing business the right way.

IMO, Waymo's plan is this:
1) Use Chandler to learn how to operate a driverless service.
2) Use SF to improve the autonomous driving to handle more difficult urban driving.
3) Use NYC to improve the autonomous driving to handle more difficult dense urban driving.
4) Scale!

Combine the 3 and IMO you have the necessary ingredients for a profitable driverless service because you have both the experience for HOW to operate a driverless service and the driverless that is safe and smooth enough in a profitable service area.
 
Last edited:
Leave it to Tesla fans to criticize Waymo that has been operating a commercial driverless service for 1.5 years and 500k miles, as somehow "failing", while ignoring Tesla that can't even deploy 1 robotaxi and has been selling vaporware for 6 years. But I am sure Tesla will deploy driverless service in every US city by the end of this year, right? LOL.

I am not saying Waymo is perfect. Waymo still has a lot of work to do before they can truly scale a profitable driverless service. But Waymo is the only company in the US to have a commercial driverless service running for 1.5 years and over 500k miles. That is quite an accomplishment. And Waymo is poised to launch a similar driverless service in SF. No other company in the US has been able to match that yet.
 
Last edited:
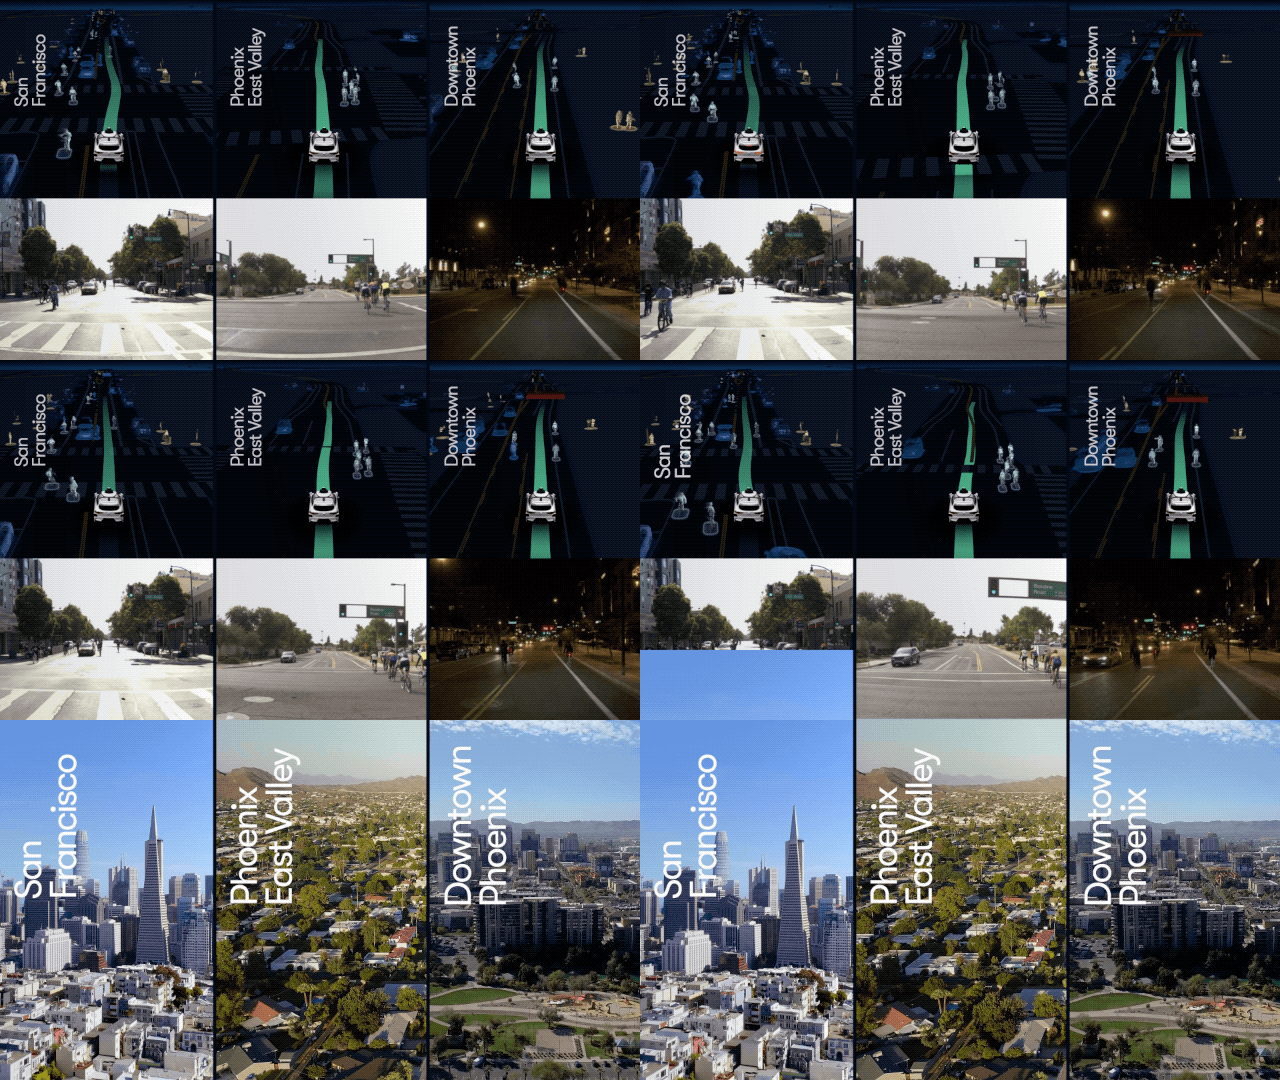
Waymo employees are now taking driverless rides in SF. And Waymo will expand to downtown Phoenix soon with a trusted tester program. They are expanding beyond Chandler!


Proof that Waymo is scaling, they are just doing it in a very methodical and safe way. But it does seem like their scaling is accelerating recently. @Bladerskb
 
Last edited:
“Building a safe, robust, and generalizable autonomous driver—the Waymo Driver—whose capabilities and performance transfer well between geographies and product lines is our main focus,” said Dmitri Dolgov, Waymo co-CEO. “Just as our previous experience allowed us to deploy our 5th-gen Driver in San Francisco quickly and with confidence, the combination of our experience in San Francisco and Phoenix’s East Valley, grounded in millions of miles of real-world driving and boosted by billions of miles driven in simulation, is already guiding our progress in Downtown Phoenix and sets us up for future expansion of our fully autonomous ride-hailing service.”


The blog on their expansion to downtown Phoenix: