Welcome to Tesla Motors Club
Discuss Tesla's Model S, Model 3, Model X, Model Y, Cybertruck, Roadster and More.
Register

What is a "normal" drop off for solar production in the Winter?

This site may earn commission on affiliate links.
I live in the San Francisco Bay Area and had my solar system installed by Tesla back in April. I'm noticing a dramatic drop off in production for the last several months and I'm hoping someone can help me understand if this is normal or if there may be an issue that I need to escalate. I have an 8.16kw Solar Panel system with 2 Powerwalls. Here is some data from my app to help:

MonthLow (daily)Avg (daily)High (daily)
July34.7 kwh46.2 kwh50.9 kwh
August26.036.745.3
September17.825.233.5
October6.412.717.8
November3.96.711.9
December3.75.38.0
January1.75.69.5

I totally understand that the angle of the sun, cloud cover, rain, etc. all will impact production and that I should expect lower production in the Fall/Winter, however this drop off seems far more extreme than what I read about on the web. I was expecting maybe a 50% drop off and not something in the 80-90% range.

I did ask Tesla to look into this and they escalated to Tier 2 support. The response I got back was that the system is "...electrically and mechanically sound. There are no indications of an electrical malfunction and all wires that combine the solar panels are operational. This system is performing optimally at 99% of its bid estimates." Before I drop the issue, I was hoping to hear from others that either my experience is normal or that something doesn't smell right and I should push harder on Tesla to investigate.

Thanks!
 
It depends on where you live. Since you're on the coast you will get a lot more marine layer days compared to further inland, even on non rainy days. In addition, being on the west coast where our rainy season is during winter and summer rain is non existent, we tend to have more dramatic difference than those east of the Rocky Mountains between the number of good winter and summer production days.

Also the further north one is the more the disparity between summer and winter due to a more drastic difference in day length between the seasons.

What I stated above is general. It doesn't consider roof pitch, shading, orientation, and etc.

My winter production is about half of my summer. But my roof pitch is close to that of the winter sun angle so I get more production during the winter than I would if the panels were more horizontal.

I also have 1/2 facing south, 1/4 facing east, and 1/4 facing west. My worst production is often during the spring when we get a marine layer every day for 50% to 100% of the day (May Grey and June Gloom.) At least in the winter it is either cloudy and raining, or mostly sunny. Even though almost all of our rain falls during winter, we actually get more sunny days in the winter than in the spring
 
Last edited:
  • Like
Reactions: sunwarriors
At my home, I go from a peak of about 53kWh during the summer to a low of about 20-21kWh in the winter with similar sunny days. My system size is 8.7kW. I would echo @power.saver and say check PVwatts for your location.

Its very specific to a particular home, for some of the reasons you already stated, as well as pitch of roof, shading for your particular home, etc. There is likely some shading that occurs on your roof / panels at this angle of sun that doesnt occur at the angles its at during the summer.
 
Here's a location-based calculator for insolation (amount of sunlight received) that should help give you a baseline: Solar Insolation Calculator | Fabhabs
This is good and it gives your control over certain confounding variables. For example I turned off panel inefficiency in this calculator since my panels produce about 100 watts more (350 watts) than my microinverters output wattage (240 watts.) Even on the hottest 100+ degree days my micorinverters are still sending out max power during peak time. I just need to make sure I multiply by my microinverter output AC wattage and not the rated panel DC wattage
 
  • Helpful
Reactions: pilotSteve
This has been helpful. Thank you!

In looking at PVWatts and the other calculator provided by @k808a, I should expect somewhere between 2.093 and 2.95 kWh/M^2/day. For an 8.16kw system, that would equate to 17-24 kwh per day in expected generation for January. I'm clocking in at 5.6 which seems pretty low. I plugged in July as a comparison and the expected is 48.5-63 kwh per day which is somewhat in line to what I actually observed in the app for July. There is an annoying tree from a neighbor that shades my roof a bit and affects my south facing panels more in the winter. The other plans in my design are unaffected by shade. So my production does seem lower than I would have expected, but maybe not so low that would indicate a mechanical issue. I guess I will need to impatiently await the Spring to improve production.
 
  • Like
Reactions: pilotSteve
Here's a location-based calculator for insolation (amount of sunlight received) that should help give you a baseline: Solar Insolation Calculator | Fabhabs

This is the first I have seen of this particular calculator, but thanks for sharing! Seems easier to use that pvwatts, and looking at my own address and knowing my historical production, seemed to be pretty accurate for me.

I put in my address, got the numbers multiplied by my panel watt, and then multiplied by my number of panels, and got a number that is pretty close to my historical production for the months I eyeballed.
 
My production in Sonoma County is lower than predicted. However the drought is over because we got more rain to date than all of last year. That cloudy weather is a big factor in what you are seeing. Be happy, the days are getting longer.
 
Last edited:
have you inspected the generation curve? i have this stupid cedar tree which shades my panels about 5 months per year. there's a tree-shaped dent in the curve which grows from equinox solstice and then shrinks back from solstice to equinox. you could have something like that going on... or maybe a chimney that shades a lot in the winter and less in the summer, etc.
 
@astrorob how do I inspect the "generation curve"? I don't think I'm familiar with that functionality. Is it somewhere in the Tesla app?
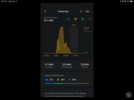
It’s just the simple progressive graph when you click on “Energy”. In my example, you can see there is a dip around 9:00am due to some clouds passing by, then there is a sharp drop after 12:30pm due to shading from some tall pine trees south of my house. It recovered a little after that but then the sun is at a very low angle this time of the year. That sharp drop does not happen from April to August because the sun is at a much higher angle.
 

Attachments

  • 7D774712-360A-4AFB-A97F-0D16AB6E0AF8.png
    7D774712-360A-4AFB-A97F-0D16AB6E0AF8.png
    224.9 KB · Views: 128
My system produces about 70-80 kWh a day at the summer solstice (June 21) and did 8 kwH on a day near the winter solstice (Dec 21). This is pretty close to what Tesla says the system should produce for those dates. We have a 12.75 kW Solarroof. And we do get shading in the fall and winter. We are in the Tri-Valley.