Like
@mrdoubleb I'd too like to see how you arrived at that gross margin number, because it's contradicted by several other sources of gross margin data. Can you list key inputs, assumptions and justification of how you arrived at those numbers?
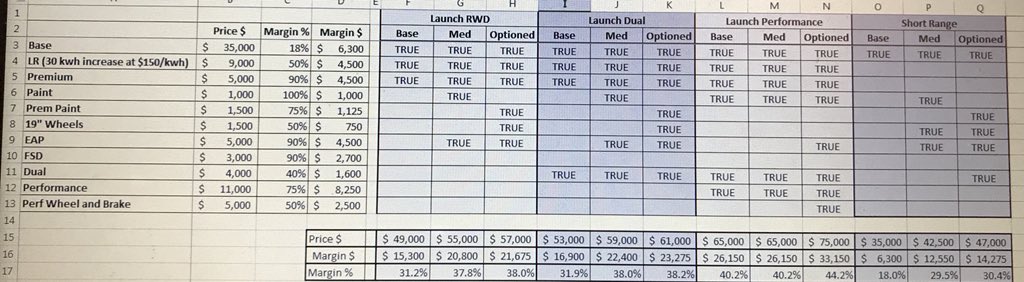
All of the assumptions are right there in the model which you can vary yourself (although it drops some nuance for simplicity because it assumes every car at a certain price point has the same margin). Otherwise, it's just math. When you argue that most people will take up the EAP @100% incremental margin you are raising the average ASP in that model, but if you do that while holding overall margin constant, the effect is actually to reduce the implied GM on non-EAP configurations.
If GM is 15% this quarter on 60k$ ASP (9k$ GP) and 100% of those people bought 100% margin EAP that means that a 55k$ ASP non-EAP variation of that analysis only has 4k$ in total margin. It's math.
So if you work backwards from what it means to sell 60k$ at 15% GM, the implications are that the gross margin on the 35k$ model is absurdly bad (-5k$ give or take, maybe even more), and I am asking for what categories of savings exist, what they are, and how big they are.
For instance, I was looking at warranty info. I don't know if this forum has analyzed this but it looks to me like S/X was cruising at about 2.1k$ warranty reserve (which goes into COGS) but as of Q2 the model 3 was 3.6k$ or so, and obviously that's temporary. That would be a big boost. D&A and general assembly labor don't seem like big enough items to matter much but might contribute another 1k$ or so IMO. It would seem to me the biggest thing left is part scrap and reworking, which is hard to measure and maybe that's where we're left is just faith in that.
I definitely agree Tesla will walk down the ladder and release configs from high GP to low GP. The only counterbalance to that is they have to be careful I think not to create a situation where they suck out too much of the higher priced configs and can't maintain it the next quarter and end up with lower profitability the following quarter, since that would lead to all kinds of rampant negative speculations. Safer to cautiously improve even if you have to mix in lower profit models and therefore deliberately underoptimize.
An example of where you can take that modelling approach. Here is a potential 500k\year pace sketched out. It notably includes GM on that 35k$ going from -5k$ to 2.5k$ (I don't know how they do that exactly, I am just asserting it). The overall ASP is ~50k$ which strikes me as intuitive although it's much higher than Elon's 42k$. It's important to watch the total gross profit number which goes from ~500M$ on my first model to 1.38B$ here as that's ultimately the only thing that matters. If you wanted to walk that GP back down to 800M$ to be conservative, you could vary the GM on the base model and it would show you just how far they are from here. You could also vary the proportion of sales at each price point. etc. All of this is good for developing intuitions.
Price | Volume | Gross Profit | Inc. Margin | Gross Margin
$35,000 14000 $2,500.00 7.14%
$40,000 24000 $5,250.00 55.00% 11.67%
$45,000 22000 $8,100.00 57.00% 18.00%
$50,000 20,000 $11,050.00 59.00% 22.10%
$55,000 18,000 $14,100.00 61.00% 25.64%
$60,000 12,000 $17,250.00 63.00% 28.75%
$65,000 7,000 $20,500.00 65.00% 31.54%
$70,000 4,000 $23,850.00 67.00% 34.07%
$75,000 2,500 $27,300.00 69.00% 36.40%
$80,000 1500 $30,850.00 71.00% 38.56%
$49,540.00 125000 $10,995.40 22.19%
Total Gross Profit $1,374,425.00