Welcome to Tesla Motors Club
Discuss Tesla's Model S, Model 3, Model X, Model Y, Cybertruck, Roadster and More.
Register

National and State Renewable Energy stats

This site may earn commission on affiliate links.
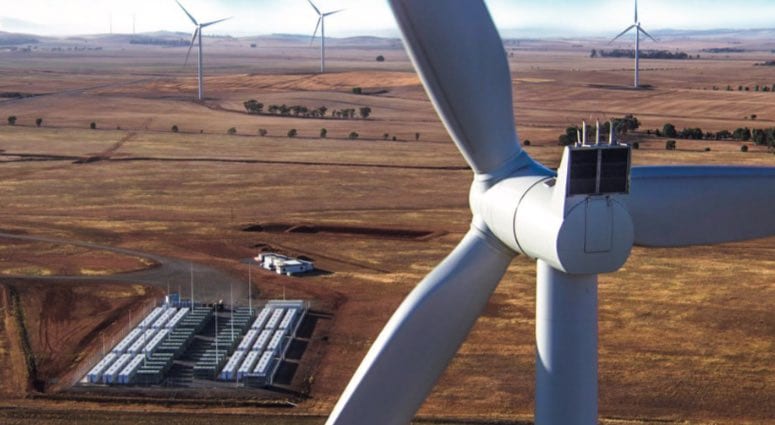
Come on NSW and QLD, get some more wind!

Yep. Although it is finally happening, quite a few wind farms under construction in both states.

Bango wind farm in NSW will be 244 MW, 46 turbines, it was to be fully operational by the end of 2022/early 2023. It is the second largest wind farm in the state. More are in the pipeline following the latest REZ auctions.

In QLD, Kaban Green (130 MW), Dulacca (180 MW) and Macintyre (1026 MW - the nation’s biggest) are under construction. Forest Wind is hoping to trump that (1200 MW) and is going through the planning approval process.
There is also the SA connector so instead of shutting down rooftop solar when the commercial farms are maxing, it will be sent to NSW. This should drive more major renewable investment is SA
 
The stats for February - a slight drop nationally for renewable generation as we reach the end of summer. SA now regularly maxes out at ~98.5% peak renewable, since there is a mandated minimum level of gas generation that is always there, preventing SA reaching 100% (note these stats are based solely on in-state generation, not in-state generation divided by in-state demand, which I think is a bit dodgy).

Renewable energy generation for February - average for the month:
  • National - 38.1%
  • TAS - 99.7%
  • SA - 81.2%
  • VIC - 39.5%
  • WA - 36.1%
  • NSW - 34.6%
  • QLD - 25.6%
Peak renewable generation for February - and time of occurrence:
  • National - 65.9% on 11 Feb 13:45
  • TAS - 100.0% on many occasions
  • SA - 98.5% on 24 Feb 12:15
  • WA - 73.9% on 11 Feb 12:45
  • NSW - 68.8% on 04 Feb 11:00
  • VIC - 67.4% on 24 Feb 12:45
  • QLD - 59.3% on 12 Feb 11:45
Daytime renewable performance for February - renewable percentage when solar production is not zero:
  • National - 42.3%
  • TAS - 99.5%
  • SA - 84.1%
  • VIC - 45.3%
  • NSW - 42.9%
  • WA - 42.3%
  • QLD - 33.9%
Nighttime renewable performance for February - renewable percentage when solar production is zero:
  • National - 23.2%
  • TAS - 99.9%
  • SA - 73.6%
  • VIC - 28.4%
  • WA - 26.0%
  • NSW - 16.1%
  • QLD - 8.0%
Diurnal renewable hardness for February - ratio of nighttime renewable percentage to daytime:
  • National - 0.55
  • TAS - 1.00
  • SA - 0.88
  • VIC - 0.63
  • WA - 0.61
  • NSW - 0.38
  • QLD - 0.24
Small Scale / Rooftop solar as a proportion of all generation for February - invisible to AEMO:
  • National - 12.9%
  • SA - 26.4%
  • WA - 16.5%
  • NSW - 12.5%
  • QLD - 11.6%
  • VIC - 11.3%
  • TAS - 5.1%
Renewable mix for February - solar includes small-scale solar, hydro includes pumped hydro:
  • National - Wind: 33.7%, Solar: 53.3%, Hydro: 12.9%
  • NSW - Wind: 23.8%, Solar: 67.7%, Hydro: 8.5%
  • QLD - Wind: 12.6%, Solar: 78.9%, Hydro: 8.5%
  • SA - Wind: 56.6%, Solar: 43.4%, Hydro: 0.0%
  • TAS - Wind: 19.7%, Solar: 5.1%, Hydro: 75.2%
  • VIC - Wind: 48.9%, Solar: 39.8%, Hydro: 11.3%
  • WA - Wind: 54.0%, Solar: 46.0%, Hydro: 0.0%
SNSWNB Index for February - sun not shining wind not blowing index: total duration in minutes spread across N separate periods:
  • National - 0 minutes across 0 periods
  • NSW - 0 minutes across 0 periods
  • QLD - 0 minutes across 0 periods
  • SA - 0 minutes across 0 periods
  • TAS - 0 minutes across 0 periods
  • VIC - 0 minutes across 0 periods
  • WA - 0 minutes across 0 periods
 
Queensland really needs some more wind.

Yep, but there are now a number of massive wind farms under construction in QLD which will help, including Australia’s largest (Macintyre) at 1026 MW. Better late than never I guess.

NSW needs a lot more wind too, but has a couple of offshore wind farms in the planning stage. I don’t think QLD will ever have offshore wind, there is this thing called the Great Barrier Reef which folk might be sensitive about 😄 even though shallow waters would be great for construction. Tropical cyclones would be another factor.
 
  • Like
Reactions: meloccom
Tesla Investor day called out South Australia as a world leader in the wind/solar/battery space. Go Croweaters!

That’s because they absolutely are world leaders! SA’s achievements in VRE should be a source of immense national pride. Getting to 100% VRE is now within reach and something the right-wing talking heads and columnists predicted was impossible.
 
  • Like
Reactions: meloccom
The stats for March. National percentage of 35% is up 270 basis points from 1 year ago and 610 basis points from 2 years ago.

SA’s peak of 99.8% is a new record. I read in RenewEconomy recently that SA were going to trial taking one of their gas synchronous machines offline and maintain grid synchronisation with a synchronous condenser instead, leaving only one gas generator online. I wonder if it has anything to do with that.

Renewable energy generation for March - average for the month:
  • National - 35.0%
  • TAS - 99.0%
  • SA - 74.4%
  • VIC - 36.0%
  • NSW - 32.1%
  • WA - 31.6%
  • QLD - 22.9%
Peak renewable generation for March - and time of occurrence:
  • National - 65.9% on 05 Mar 12:45
  • TAS - 100.0% on many occasions
  • SA - 99.8% on 25 Mar 16:15
  • WA - 74.7% on 19 Mar 13:00
  • NSW - 69.4% on 05 Mar 12:45
  • VIC - 65.9% on 07 Mar 12:45
  • QLD - 59.4% on 31 Mar 13:15
Daytime renewable performance for March - renewable percentage when solar production is not zero:
  • National - 36.3%
  • TAS - 99.0%
  • SA - 75.7%
  • VIC - 42.0%
  • NSW - 40.6%
  • WA - 38.8%
  • QLD - 32.3%
Nighttime renewable performance for March - renewable percentage when solar production is zero:
  • National - 23.5%
  • TAS - 99.0%
  • SA - 66.9%
  • VIC - 26.1%
  • WA - 21.5%
  • NSW - 16.7%
  • QLD - 6.4%
Diurnal renewable hardness for March - ratio of nighttime renewable percentage to daytime:
  • National - 0.65
  • TAS - 1.00
  • SA - 0.88
  • VIC - 0.62
  • WA - 0.55
  • NSW - 0.41
  • QLD - 0.20
Small Scale / Rooftop solar as a proportion of all generation for March - invisible to AEMO:
  • National - 11.3%
  • SA - 24.0%
  • WA - 15.7%
  • NSW - 10.7%
  • QLD - 10.6%
  • VIC - 9.6%
  • TAS - 3.7%
Renewable mix for March - solar includes small-scale solar, hydro includes pumped hydro:
  • National - Wind: 33.0%, Solar: 50.0%, Hydro: 17.0%
  • NSW - Wind: 25.4%, Solar: 60.7%, Hydro: 13.9%
  • QLD - Wind: 10.4%, Solar: 79.9%, Hydro: 9.7%
  • SA - Wind: 56.9%, Solar: 43.1%, Hydro: 0.0%
  • TAS - Wind: 20.6%, Solar: 3.8%, Hydro: 75.7%
  • VIC - Wind: 51.1%, Solar: 36.5%, Hydro: 12.4%
  • WA - Wind: 50.1%, Solar: 49.9%, Hydro: 0.0%
SNSWNB Index for March - sun not shining wind not blowing index: total duration in minutes spread across N separate periods:
  • National - 0 minutes across 0 periods
  • NSW - 0 minutes across 0 periods
  • QLD - 105 minutes across 3 periods
  • SA - 0 minutes across 0 periods
  • TAS - 0 minutes across 0 periods
  • VIC - 0 minutes across 0 periods
  • WA - 0 minutes across 0 periods
 
The stats for April. Renewable energy percentage was higher than in March! And it is solely due to QLD jumping from 22.9% to 25.9%.

And NSW’s renewable energy peak for the month occurring on 28 April - the same day that the Liddell coal-fired power station permanently closed down its last boiler. A coincidence? I think not!

Renewable energy generation for April - average for the month:
  • National - 35.4%
  • TAS - 99.2%
  • SA - 71.8%
  • VIC - 32.9%
  • NSW - 30.4%
  • WA - 28.8%
  • QLD - 25.9%
Peak renewable generation for April - and time of occurrence:
  • National - 63.7% on 14 Apr 12:45
  • TAS - 100.0% on many occasions
  • SA - 97.4% on 16 Apr 12:30
  • WA - 72.3% on 14 Apr 13:30
  • NSW - 67.8% on 28 Apr 11:45
  • VIC - 66.0% on 18 Apr 12:30
  • QLD - 62.7% on 13 Apr 14:00
Daytime renewable performance for April - renewable percentage when solar production is not zero:
  • National - 36.6%
  • TAS - 99.3%
  • SA - 74.5%
  • NSW - 41.2%
  • VIC - 38.9%
  • WA - 38.2%
  • QLD - 33.4%
Nighttime renewable performance for April - renewable percentage when solar production is zero:
  • National - 24.7%
  • TAS - 99.2%
  • SA - 61.1%
  • VIC - 25.0%
  • WA - 17.0%
  • NSW - 16.1%
  • QLD - 8.4%
Diurnal renewable hardness for April - ratio of nighttime renewable percentage to daytime:
  • National - 0.67
  • TAS - 1.00
  • SA - 0.82
  • VIC - 0.64
  • WA - 0.45
  • NSW - 0.39
  • QLD - 0.25
Small Scale / Rooftop solar as a proportion of all generation for April - invisible to AEMO:
  • National - 10.4%
  • SA - 19.1%
  • WA - 15.6%
  • QLD - 11.1%
  • NSW - 9.9%
  • VIC - 7.6%
  • TAS - 2.4%
Renewable mix for April - solar includes small-scale solar, hydro includes pumped hydro:
  • National - Wind: 33.9%, Solar: 46.9%, Hydro: 19.2%
  • NSW - Wind: 27.5%, Solar: 59.3%, Hydro: 13.2%
  • QLD - Wind: 12.9%, Solar: 77.1%, Hydro: 10.0%
  • SA - Wind: 63.8%, Solar: 36.2%, Hydro: 0.0%
  • TAS - Wind: 15.4%, Solar: 2.4%, Hydro: 82.2%
  • VIC - Wind: 55.2%, Solar: 34.1%, Hydro: 10.7%
  • WA - Wind: 45.6%, Solar: 54.4%, Hydro: 0.0%
SNSWNB Index for April - sun not shining wind not blowing index: total duration in minutes spread across N separate periods:
  • National - 0 minutes across 0 periods
  • NSW - 0 minutes across 0 periods
  • QLD - 0 minutes across 0 periods
  • SA - 0 minutes across 0 periods
  • TAS - 105 minutes across 2 periods
  • VIC - 0 minutes across 0 periods
  • WA - 0 minutes across 0 periods
 
The stats for May. Some wind doldrums for SA dragging the average down. But overall given the season the numbers have held up reasonably well.

Renewable energy generation for May - average for the month:
  • National - 33.7%
  • TAS - 99.4%
  • SA - 58.1%
  • VIC - 32.0%
  • WA - 28.5%
  • NSW - 28.1%
  • QLD - 25.0%
Peak renewable generation for May - and time of occurrence:
  • National - 66.1% on 3 May 14:00
  • TAS - 100.0% on many occasions
  • SA - 98.3% on 28 May 15:15
  • WA - 69.9% on 20 May 15:00
  • NSW - 67.8% on 3 May 13:00
  • QLD - 62.4% on 8 May 12:45
  • VIC - 61.5% on 3 May 13:45
Daytime renewable performance for May - renewable percentage when solar production is not zero:
  • National - 34.4%
  • TAS - 99.5%
  • SA - 66.1%
  • NSW - 38.3%
  • WA - 36.2%
  • VIC - 36.0%
  • QLD - 26.4%
Nighttime renewable performance for May - renewable percentage when solar production is zero:
  • National - 23.4%
  • TAS - 99.4%
  • SA - 48.3%
  • VIC - 27.5%
  • WA - 20.9%
  • NSW - 16.6%
  • QLD - 7.9%
Diurnal renewable hardness for May - ratio of nighttime renewable percentage to daytime:
  • National - 0.68
  • TAS - 1.0
  • VIC - 0.76
  • SA - 0.73
  • WA - 0.58
  • NSW - 0.43
  • QLD - 0.3
Small Scale / Rooftop solar as a proportion of all generation for May - invisible to AEMO:
  • National - 8.1%
  • SA - 12.4%
  • WA - 11.9%
  • QLD - 10.0%
  • NSW - 8.1%
  • VIC - 4.9%
  • TAS - 1.4%
Renewable mix for May - solar includes small-scale solar, hydro includes pumped hydro:
  • National - Wind: 38.2%, Solar: 38.6%, Hydro: 23.2%
  • NSW - Wind: 27.9%, Solar: 49.8%, Hydro: 22.3%
  • QLD - Wind: 18.2%, Solar: 74.3%, Hydro: 7.5%
  • SA - Wind: 69.2%, Solar: 30.8%, Hydro: 0.0%
  • TAS - Wind: 17.9%, Solar: 1.4%, Hydro: 80.7%
  • VIC - Wind: 64.2%, Solar: 22.1%, Hydro: 13.6%
  • WA - Wind: 58.2%, Solar: 41.8%, Hydro: 0.0%
SNSWNB Index for May - sun not shining wind not blowing index: total duration in minutes spread across N separate periods:
  • National - 0 minutes across 0 periods
  • NSW - 0 minutes across 0 periods
  • QLD - 0 minutes across 0 periods
  • SA - 0 minutes across 0 periods
  • TAS - 180 minutes across 3 periods
  • VIC - 0 minutes across 0 periods
  • WA - 0 minutes across 0 periods
 
The stats for June… better than May! SA’s diurnal renewable hardness an extraordinary 0.97 (a record) meaning its renewable percentage overnight was almost the same as it was during the day. VIC also topping 0.9 on this metric for the first time. Some very good wind conditions last month.

SA’s peak renewable percentage also happened overnight… the first time this has ever occurred, in any state.


Renewable energy generation for June - average for the month:
  • National - 34.9%
  • TAS - 99.5%
  • SA - 74.1%
  • VIC - 40.3%
  • NSW - 26.5%
  • QLD - 22.4%
  • WA - 18.1%
Peak renewable generation for June - and time of occurrence:
  • National - 63.7% on 25 Jun 14:30
  • TAS - 100.0% on many occasions
  • SA - 97.8% on 16 Jun 02:45
  • NSW - 68.5% on 25 Jun 14:30
  • WA - 64.1% on 16 Jun 14:45
  • VIC - 63.9% on 16 Jun 15:00
  • QLD - 59.0% on 24 Jun 13:15
Daytime renewable performance for June - renewable percentage when solar production is not zero:
  • National - 35.9%
  • TAS - 99.5%
  • SA - 75.3%
  • VIC - 42.1%
  • NSW - 35.0%
  • WA - 25.2%
  • QLD - 25.1%
Nighttime renewable performance for June - renewable percentage when solar production is zero:
  • National - 27.5%
  • TAS - 99.5%
  • SA - 72.8%
  • VIC - 38.5%
  • NSW - 17.7%
  • WA - 11.2%
  • QLD - 7.4%
Diurnal renewable hardness for June - ratio of nighttime renewable percentage to daytime:
  • National - 0.77
  • TAS - 1.00
  • SA - 0.97
  • VIC - 0.91
  • NSW - 0.51
  • WA - 0.44
  • QLD - 0.29
Small Scale / Rooftop solar as a proportion of all generation for June - invisible to AEMO:
  • National - 6.4%
  • QLD - 9.1%
  • SA - 8.9%
  • WA - 8.0%
  • NSW - 6.3%
  • VIC - 3.8%
  • TAS - 1.1%
Renewable mix for June - solar includes small-scale solar, hydro includes pumped hydro:
  • National - Wind: 47.4%, Solar: 29.7%, Hydro: 22.9%
  • NSW - Wind: 35.7%, Solar: 42.2%, Hydro: 22.1%
  • QLD - Wind: 20.1%, Solar: 73.4%, Hydro: 6.5%
  • SA - Wind: 83.2%, Solar: 16.8%, Hydro: 0.0%
  • TAS - Wind: 17.6%, Solar: 1.1%, Hydro: 81.3%
  • VIC - Wind: 73.1%, Solar: 13.0%, Hydro: 13.9%
  • WA - Wind: 55.8%, Solar: 44.2%, Hydro: 0.0%
SNSWNB Index for June - sun not shining wind not blowing index: total duration in minutes spread across N separate periods:
  • National - 0 minutes across 0 periods
  • NSW - 0 minutes across 0 periods
  • QLD - 0 minutes across 0 periods
  • SA - 0 minutes across 0 periods
  • TAS - 0 minutes across 0 periods
  • VIC - 0 minutes across 0 periods
  • WA - 0 minutes across 0 periods
 
The stats for July. A mid-winter record of 35.6%. 3 years ago the July figure was 21.5%! Also this July figure is higher than the November figure of 2021 (35.0%).

NSW ahead of WA for the first time since Sep 2020. Looks like getting rid of a coal clunker has been good for VRE.


Renewable energy generation for July - average for the month:
  • National - 35.6%
  • TAS - 99.8%
  • SA - 72.7%
  • VIC - 39.8%
  • NSW - 28.1%
  • WA - 23.1%
  • QLD - 22.1%
Peak renewable generation for July - and time of occurrence:
  • National - 63.9% on 31 Jul 13:30
  • TAS - 100.0% on many occasions
  • SA - 98.3% on 13 Jul 16:45
  • WA - 72.8% on 02 Jul 15:30
  • NSW - 71.1% on 30 Jul 14:45
  • VIC - 64.5% on 08 Jul 14:00
  • QLD - 58.2% on 20 Jul 12:30
Daytime renewable performance for July - renewable percentage when solar production is not zero:
  • National - 38.0%
  • TAS - 99.7%
  • SA - 77.2%
  • VIC - 42.4%
  • NSW - 38.6%
  • WA - 31.1%
  • QLD - 27.7%
Nighttime renewable performance for July - renewable percentage when solar production is zero:
  • National - 27.4%
  • TAS - 99.8%
  • SA - 67.8%
  • VIC - 37.2%
  • NSW - 16.6%
  • WA - 15.2%
  • QLD - 7.9%
Diurnal renewable hardness for July - ratio of nighttime renewable percentage to daytime:
  • National - 0.72
  • TAS - 1.00
  • SA - 0.88
  • VIC - 0.88
  • WA - 0.49
  • NSW - 0.43
  • QLD - 0.29
Small Scale / Rooftop solar as a proportion of all generation for July - invisible to AEMO:
  • National - 7.1%
  • SA - 12.2%
  • WA - 9.3%
  • QLD - 8.6%
  • NSW - 7.5%
  • VIC - 4.4%
  • TAS - 1.1%
Renewable mix for July - solar includes small-scale solar, hydro includes pumped hydro:
  • National - Wind: 43.4%, Solar: 32.7%, Hydro: 23.8%
  • NSW - Wind: 31.4%, Solar: 49.0%, Hydro: 19.6%
  • QLD - Wind: 20.6%, Solar: 73.3%, Hydro: 6.2%
  • SA - Wind: 76.5%, Solar: 23.5%, Hydro: 0.0%
  • TAS - Wind: 19.8%, Solar: 1.1%, Hydro: 79.1%
  • VIC - Wind: 65.4%, Solar: 15.8%, Hydro: 18.8%
  • WA - Wind: 59.6%, Solar: 40.4%, Hydro: 0.0%
SNSWNB Index for July - sun not shining wind not blowing index: total duration in minutes spread across N separate periods:
  • National - 0 minutes across 0 periods
  • NSW - 0 minutes across 0 periods
  • QLD - 0 minutes across 0 periods
  • SA - 0 minutes across 0 periods
  • TAS - 0 minutes across 0 periods
  • VIC - 0 minutes across 0 periods
  • WA - 0 minutes across 0 periods
 
This analysis
It doesn't take into consideration that 1.1M barrels of oil is consumed in AU each day and progressively that consumption will increasingly be replaced with electricity

1 MY @ 20,000km per year = 3.3MW/year replacing 2000L petrol/year

Additionally it assumes that the AU economy continues to have an insignificant manufacturing sector and will be for the foreseeable future a dig it up economy.

Well, OK, that is true. But it will take a very long time for transportation to be fully decarbonised, for example. Even if EVs become close to 100% of all new vehicle sales within a decade, it will still take about 20 years after that for the entire fleet to be replaced. So that is a long time in which organic growth in both rooftop solar and grid supply can offset any increase in total electricity consumption.

In fact it is not widely known that the peak of grid electricity use in the NEM was winter 2008. Since then, annual grid electricity consumption in the NEM has actually decreased 9% despite the population growing 22% in that time. That is due to rooftop solar and increased energy efficiency across the entire economy.

You could also argue the article does not factor in any V2G, hence is overly pessimistic in how much storage we will need (i.e., we will actually need a lot less than estimated).

I suspect there are lots of swings and roundabouts here and not too much to hand-wring over.