Kimmi
Member
Three year old M3 LR with 29K miles. What was 353 new is 318. I can live with 10% loss in three years. Battery still shows 74kWh full capacity. Happy dance!


You can install our site as a web app on your iOS device by utilizing the Add to Home Screen feature in Safari. Please see this thread for more details on this.
Note: This feature may not be available in some browsers.
")
Do you have any facts supporting that?1) Avoid long spells (overnight) below 30 or above 80% SoC.
Do you have any facts supporting that?
Low SOC is favorable for low degradation (low calendar aging) according to all research.
(I regularly leave my car at ~7-20% at work for one week at the time. ~ 7% is to have margin for ques/road accidents and short rerouting as I go into Alert readiness when I arrive at work.
If below 30% was not good my M3P 2021 i had until this summer would not have been among the cars having the lowest degradation at teslafi etc. I had a SOC average of 35.46% the first 1.5 years).
In my world the lower SOC point is range anxiety only (as long as we do not drive below 0% or leave the car below 0%.).
I've previously understood the true SoC calculation mentioned above without ever really worrying about it. I don't worry about it now eitherOf course my 55% is adjusted for the true SOC, so safe
(Already answered exactly this a few days ago).
The true SOC limit for calendar aging invrease with SOC is around 57-58% on a new NCA cell (it sctually can differ if the chemidtry or amount of different chems on the anode or cathode).
Google calendar aging + central graphite peak for more info.
This ”limit” increases from calendar aging, so a calendar aged cell with 5% loss would have it somewhere around 60%.
But the ”limit” decreases by lithium plating, which we get from fast charging.
In general, I would guess the ”limit” goes up for more or less anybody, so 57% True SOC is safe.
The buffer is 4.5% below 0% displayed.
100% displayed = 100% true SOC.
This means the true SOC = displayed SOC + ((100- displayed SOC)x0.045.
So, 55% on screen is 57% true SOC (57.025% to be exact).
(I did double check this the first time I connected Scan my Tesla almost three years ago, so it is confirmed to be correct)
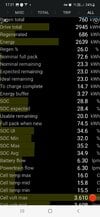
but, was rather curious about the values shown and had some problems reconciling my calculated true SoC value with the SoC data in my SMT data. Please refer to the screen capture from my SMT ("All", tab). Displayed SoC is 28.8 and I calculate true SoC to be 32 (shown as the SoC min in the screen capture). But what do the other SoC entries correspond to? Any idea?No, I havent even tried to.I've previously understood the true SoC calculation mentioned above without ever really worrying about it. I don't worry about it now either
Thanks for the insight! Good to know that they don't know eitherNo, I havent even tried to.
I guess where finte to know the displayed and true SOC for our concerns. If I remember it right, the Scan my Tesla people and the people that decoded the canbus data did not either understand it either.
One could assume that as there is imbalance in the cells, there is a slight difference in SOC (SOC is defined by the OCV on the cell). But the differences in soc max and avg is way to high compared to SOC min/true SOC so it is not that either. Just forget about them and live happily ever after