@lafrisbee @Artful Dodger
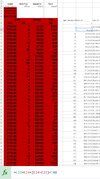
I copied the OI table from Stock Option Max Pain into Google Sheets
Then for calls I added a column of the running sum of options less than the current strike (previous sum plus the OI of the next lowest strike). Added another column that is a running total of exposure. This is the previous total + the OI_sum * (difference from current strike to previous (next lowest)).
Copy fill for all strikes.
For Puts I did the same thing but from the high end downward.
Finally, I added a column adding the call and put dollar amounts.
I also compared results to Table 2 from the web page, they all matched.
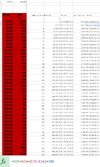