P90D
Earlier this week I took the update to 17.5.28
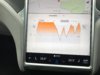
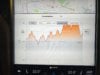
Since then I've noticed that my energy use graph (and therefore my estimated range) is looking very strange.
I see many large peaks which are literally off the graph (ie > 900 Kwh) and my estimated range is dropped dramatically down to around half of what I normally see. These peaks aren't short either- they seem to be long enough that the graph line doesn't become visible again for 0.5 miles or something..
I have just been doing my normal commute, not changing my driving style whatsoever - this normally averages at 380-400kwh. I am now seeing averages of 750-850kwh just for gently driving around London for 10 miles with the heating off!
What's strange is that I don't notice any bursts of power use and then as I keep looking at the graph I'll notice another of these big peaks appear. The graph is literally re-writing history!
Has anyone else experienced anything similar?
Earlier this week I took the update to 17.5.28
Since then I've noticed that my energy use graph (and therefore my estimated range) is looking very strange.
I see many large peaks which are literally off the graph (ie > 900 Kwh) and my estimated range is dropped dramatically down to around half of what I normally see. These peaks aren't short either- they seem to be long enough that the graph line doesn't become visible again for 0.5 miles or something..
I have just been doing my normal commute, not changing my driving style whatsoever - this normally averages at 380-400kwh. I am now seeing averages of 750-850kwh just for gently driving around London for 10 miles with the heating off!
What's strange is that I don't notice any bursts of power use and then as I keep looking at the graph I'll notice another of these big peaks appear. The graph is literally re-writing history!
Has anyone else experienced anything similar?