I'd be very interested to see a dyno for a AWD and P3D at various charge levels.
Whats most likely occurring is they are pulling the max C rate they're comfortable with from the pack. And so this means its primarily current limited. So as the pack SOC drops, the voltage drops, and as a result this means less power for the same current. Presumably by this logic the AWD would suffer less from this since its using the same pack but not run as hard. But it could be they just set the max current lower as well and it acts very similar.
However, this only impacts peak power. And the peak power only happens for a very short period on the P3D. Before the peak the motors are limiting torque, and after the peak they're showing the natural response of the motor as BEMF limits the power they will accept for the voltage. Thats why the AWD has a nearly flat power output, its electronically limited and the motor is operating below its limit.
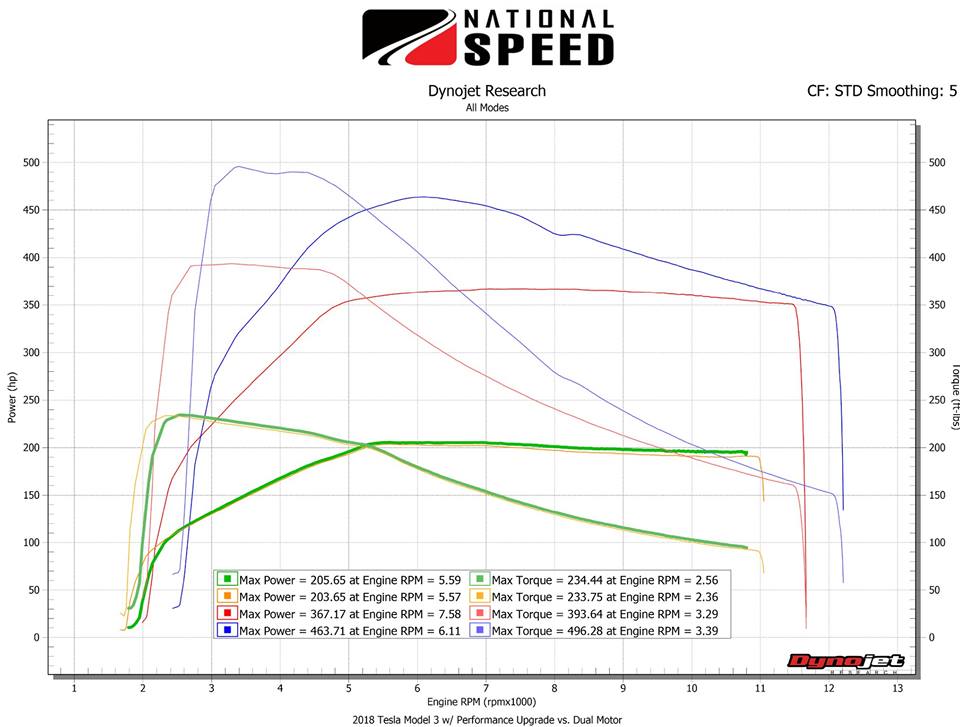
Below is a dyno of a AWD and a P3D. The two higher lines that have some shape to them are the P3D, the flatter lines in the middle are the AWD. The lines at the bottom are the overlaid P3D and AWD in 'chill'.
And below that is a LR RWD dyno across various SOC's. Steady power loss as the SOC drops. This is expected since the drive unit is likely operating against the peak battery current limit once it hits peak power. Below that its riding against the motor phase limit which is a function of the power electronics and so the battery SOC isnt important. But the peak is reached sooner, and as a result is lower as SOC drops.