Why did I not discover this website earlier 
Interactive map which shows the proportion of dwellings around Australia with rooftop solar PV, or total installed capacity. Can be filtered by postcode, LGA or State electorate.
Four postcodes apparently have over 100% penetration (data robustness error?) followed by 2174 (Edmonson Park NSW) with 95.2%, 6181 (Stake Hill in WA) with 87.3% and 5117 (Angle Vale in SA) with 82.9%.
The lowest is 2109 (Macquarie Uni, NSW) with a single 21 kW installation.
A few years ago I cobbled together a view on this using the same data sources, but APVI have done a much nicer job and map it as well as keep it up to date.
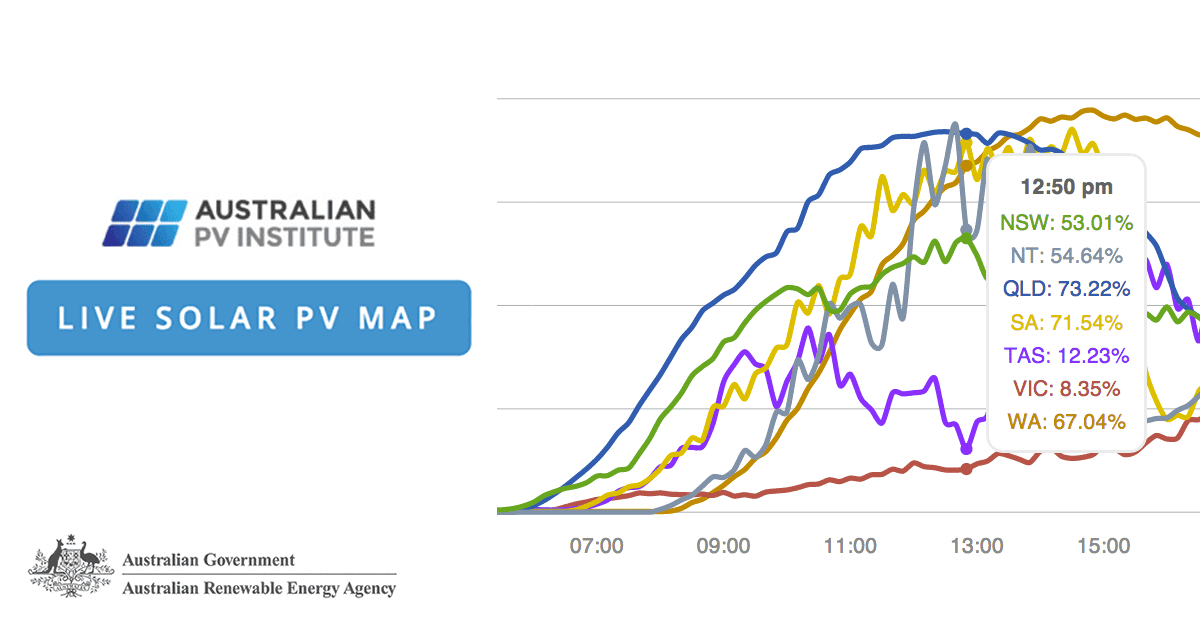
There are also tabs on this website to look at real-time PV production and other data that is heaven for stat-junkies out there.
Interactive map which shows the proportion of dwellings around Australia with rooftop solar PV, or total installed capacity. Can be filtered by postcode, LGA or State electorate.
Four postcodes apparently have over 100% penetration (data robustness error?
) followed by 2174 (Edmonson Park NSW) with 95.2%, 6181 (Stake Hill in WA) with 87.3% and 5117 (Angle Vale in SA) with 82.9%.The lowest is 2109 (Macquarie Uni, NSW) with a single 21 kW installation.
A few years ago I cobbled together a view on this using the same data sources, but APVI have done a much nicer job and map it as well as keep it up to date.
There are also tabs on this website to look at real-time PV production and other data that is heaven for stat-junkies out there.

 I better ring them up to tell them someone nicked it