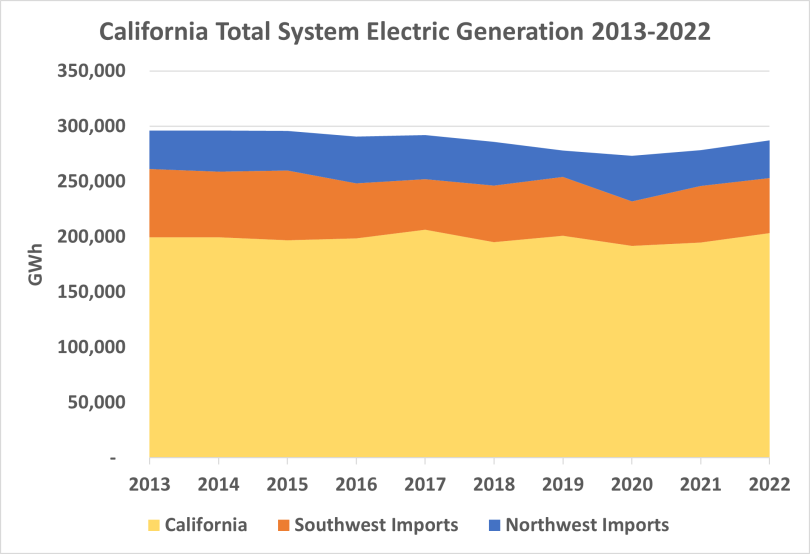
Interesting chart
@iPlug. It must be derived from different data than the CAISO supplied data, though I haven't checked the source provided.
I have been tracking the CAISO supplied data for total electric power. See my second screen capture for where I pull the data from for the first chart, that shows total power. If my data only includes California, then it should somewhat match the Gold data you show here.
The increase from 2020 to 2022 really doesn't match what my CAISO data shows. Actually, now that I eyeball it a bit more, they do seem to match. A dip after 2016, rise from 2020 to 2022, then the drop I show that isn't yet in the chart you show.
View attachment 1016171View attachment 1016172


 electrek.co