Speed vs efficiency data
- Model Y: Driving Dynamics
- 28 Replies
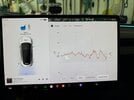
This is a graph showing the efficiency vs speed driven. It's approx 25k miles of data from my Model Y Performance.
100% efficiency is considered 'rated range'. Basically the energy consumption that would give you the range the car shows.
I think the graph is helpful to understand how speed affects...
100% efficiency is considered 'rated range'. Basically the energy consumption that would give you the range the car shows.
I think the graph is helpful to understand how speed affects...