Welcome to Tesla Motors Club
Discuss Tesla's Model S, Model 3, Model X, Model Y, Cybertruck, Roadster and More.
Register

Papafox's Daily TSLA Trading Charts

This site may earn commission on affiliate links.
nov10chart.jpg

novchart2.jpg

TSLA charts above
nov10qqq.jpg

QQQ chart above

Wednesday began with a big Mandatory Morning Dip right after open which triggered stop losses set at $1000 and then bottomed out at about $988. Whatever the plan was, it didn't last long, for within about 8 minutes of market open TSLA was back in the green and climbing fast. TSLA was under the alternate uptick rule, so the really aggressive short selling was constrained.

A robust 41.3M shares traded on Wednesday, down from Tuesday's level but still hefty. Overall, TSLA was a beast on Wednesday, paying some attention to the NASDAQ's big dip after 2pm but then shrugging off the macro's losses for the most part and climbing hard into close. With NASDAQ down 1.66% and TSLA up 4.34% at close, TSLA outperformed the NASDAQ by about 6% on Wednesday.

After hours trading was pretty level through 6pm, but as you can see by the lower TSLA chart, around 6:20pm TSLA started climbing again and brought the stock to $1096 approaching 8pm. This after-hours burst was apparently fueled by the first couple Form 4 filings appearing on Tesla IR's SEC forms page. Initially just 2 filings were available but by 9pm Pacific time, 10 filings were present, covering Elon stock sales on Nov 8, 9, and 10. By 9pm Pacific time, Rob had gone through the forms, counted approx 4.5M shares sold, and showed the results on his Twitter feed. That's still quite short of 17M shares that Elon is expected to sell. There were also more than 2.1M shares acquired through exercising his stock options. Since each batch of sales of shares requires a separate entry in the SEC form 4, it's likely that more forms still need to be completed and filed.

We are left with partial information to work with. Apparently portfolio managers can fill in the blanks because Wednesday's trading, and particularly Wednesday evening's trading after the first forms were posted, was sending the stock price up quickly.

Thursday should give us a more complete picture.


nov10treas.jpg

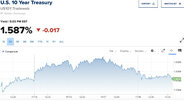
Markets sank on Wednesday because of a big surge in inflation. The 10 year treasury bond yields rose as a result, but they're still within recent ranges.

nov10maxp.jpg

Max pain stood at 1120 Wednesday morning. Looking at the chart, the call options dominate starting at about the 1150 strike, which is the green line reaching up to about 14K contracts. Below 1150 puts dominate. Massive option bets have been made for both puts and calls and if the market makers can thread the needle and tweak the stock price into the transition point from put domination to call domination, they could make a killing this week. Expect the chart to change noticeably on Thursday morning, due to the positive trading on Wednesday.

nov10tech.jpg

Nice to see the recovery apparently beginning. With upper bollinger band at 1309 now, there's lots of headroom should conditions warrant more climbing.

Conditions:
* Dow down 240 (0.66%)
* NASDAQ down 264 (1.66%)
* SPY down 4 (0.80%)
* TSLA 1067.95, up 44.45 (4.34%)
* TSLA volume 41.3M shares
* Oil 81.34
* IV 65.7, 72%
* Max Pain 1120
 
nov11chart.jpg

TSLA Chart above
nov11qqq.jpg

QQQ chart above

Thursday was one of those wait and see kind of trading days. On one hand, Elon's stock sale looks far from complete. OTOH, with Shanghai October numbers in, Q4 looks like it is going to once again surprise the analyst expectations and become the best quarter yet. Consequently, volume was down to a more typical 21.9M shares traded as we all wait for more information.

Fortunately, clues are giving us more clarity of why TSLA traded the way it did so far this week. Here's a post from Tesla Facts (our old TMC friend Fact Checking) that gives a nice summary. I'll highlight max pain options charts through the week with you and I'll offer a more nuanced explanation.
nov11teslafacts.jpg

So, let's look at the charts. For changes due to Monday's trading we compare the Monday morning chart with the Tuesday morning chart.

nov8and9maxp.jpg

Monday morning's max pain chart on top and Tuesday morning's max pain chart immediately below it

As you can see from the two charts above, we saw some increase in puts on Tuesday morning, which suggests some selling pressure on market makers to remain delta-neutral. It's really hard to compare the small quantities of in the money calls between charts, but we can see that 1200, 1250, and 1300 strike calls actually increased in numbers between Monday morning and Tuesday morning. All in all, it looks like some light downward pressure on Market Makers (need to sell shares to remain delta-neutral).

nov10maxp - Copy.jpg

Wednesday morning's max pain chart above
Now let's look at the Tuesday morning and Wednesday morning charts above, which gives us an idea of how puts and calls changed after Tuesday's trading. While we see some growth in call options after Tuesday, the largest growth is in put options. As you would expect, all these new puts forced the market makers to sell shares in order to remain delta-neutral. Just as importantly, the drop in stock price by nearly $100 increased the delta on existing puts and decreased the delta on existing calls, furthering the downward pressure placed upon market makers.

Keep in mind that market makers do not just hold one hundred shares for each call and sell one hundred shares for each put. They instead buy or sell the delta. If a call option has a delta of .5, the market makers only have to buy 50 shares to hedge it. If the stock price drops $100 that day, the delta will become something less than .5 because the call has moved quite a bit farther out of the money and the MM can sell the difference. The reverse is true with puts. As the stock price dips $100, the delta increases on most existing puts and the MM must sell shares to compensate in order to stay delta-neutral.

My point is that both the increase in number of puts and the drop in the stock price cause the market makers to sell shares. This is important to understand because Tuesday morning began with a massive mandatory morning dip that was the result of a bear attack (stock traders and market makers didn't move that quickly for delta-hedging to cause the dip). Hedge funds shorted like crazy to get the ball rolling downhill, and once the stock price started falling and both investors and manipulating hedge funds started buying more puts, the delta-hedging magnified the dip. Of course rapid buying of puts would also force delta-hedging, but the quickest way to get the stock losing value was to short-sell it. Hedge funds saw a terrific setup for the market to enhance the dip because investors were already jittery from Monday's dip. Also, Tuesday did not begin with the big gap down at open as Monday, and so the potential for profits by shorting TSLA on Tuesday to get the ball rolling, combined with buying puts was a setup for big profits for initiating such a bear attack.

nov11spotg.jpg

Here's the SpotGamma chart that Tesla Facts refers to covering Tuesday, Nov 9

On Wednesday, investors decided that Tuesday's dip had been overdone, so they started buying. That buying pushed the stock price up which cause market makers to buy more shares to hedge. With so many options out there, movements in one direction or the other tend to get exaggerated at present. Thursday was the hangover when investors understood that only 4.5 million Elon shares had been sold so far.

nov11maxp.jpg

Thursday morning's max pain chart above
Max pain has dipped to 1110 as of Thursday morning. That 1110 also appears to be close to the put vs calls domination divider and would be a really profitable place for market makers if the price could close nearby on Friday.

The market is ready for TSLA to recover when Elon's selling is complete, but that process is painfully slow at present. Let's hope for positive news on Friday. The most positive aspect of Friday is that the market makers would profit if TSLA rose toward 1110.


nov11tech.jpg

Looks like the mid bollinger band was once again useful as support on Thursday.

Conditions:
* Dow down 159 (0.44%)
* NASDAQ up 82 (0.52%)
* SPY up 0 (0.03%)
* TSLA 1063.51, down 4.44 (0.42%)
* TSLA volume 21.9M shares
* Oil 81.59
* IV 62.0, 62%
* Max Pain 1110
 
Last edited:
nov12chart.jpg

TSLA chart above

nov12qqq.jpg

QQQ chart above

Fridays are trading days with TSLA that typically include a big component of market maker tweaking. With an obvious bias for market makers to push the stock price higher toward the max pain number and for TSLA to fall nearly 3% on a Friday when the NASDAQ was up 1%, something is up. No news of consequence had come out between the neutral day of Thursday and the big down day of Friday. An extra 600K shares sold by Elon probably doesn't explain that large a difference between NASDAQ and TSLA performance. That pretty much leaves those not-so-adorable pirates the hedge funds as the likely explanation for the day's excessive losses, when you consider that the dip was inappropriate for normal market sentiment to generate such a decline. I have shown previously that since Tuesday hedge funds have undoubtedly been making lots of money generating a dip, short-selling toward the top to get things rolling downhill, covering toward the bottom, and along the way buying puts to further enrich themselves while simultaneously adding downward pressure to the stock price. They manage to make money by leveraging the fears of TSLA's investors and inducing sales either through pushing through stop-loss targets at key price points or wearing investors down. If you look back at Thursday's max pain chart you'll see many in the money puts that paid off Friday. Making money on the stock market is pretty easy when investors are unsure and you have the horsepower to move the stock price.

That said, let's look at the week as a whole. I had been expecting a typical Goldman Sachs or Morgan-Stanley handling of the sale. Instead, we have this excruciatingly slow removal of the band aid that maximizes the pain. Keep in mind the two purposes of the stock sale: raise money to pay taxes on exercising Elon's stock options and also to emphasizing how much money Elon is paying in taxes so that he can position himself to be outspoken in defending against taxes on unrealized gains in future years. He has previously been an example of billionaires avoiding taxes, and it will take a serious tax payment to make himself seen as paying more than his fair share. Is this a rational position? I think it is. Imagine the day when Elon is a Trillionaire (it's coming). Even a 1% tax on unrealized gains amounts to $10 billion per year. He's willing to spend an extra $5 billion this year in order to keep that tax on unrealized gains from ever happening. I also think that Elon has an eye toward fairness and not being a hypocrite. Is it rational? For Elon, you bet.

Regarding shares sold already, here's what @winfield100 came up with in this post:
Nov 08- 934,091 shares
Nov 09- 3,088,047 shares
Nov 10- 500,000 shares
Nov 11- 639,737 shares
Nov 12- 1,200,000 shares
Total: 6,361,875 shares

Where do we go from here? I don't believe all of Elon's shares need to be sold before we hit bottom. At some point sufficiently beyond the halfway point, those portfolio managers and those investors playing the dip will get nervous. Some rise will get a bigger rise going and it's off to the races. With so many buyers waiting for a bottom, the climb back up could be ferociously quick. Remember that Q4 still looks to be very good. We're only halfway through the quarter and problems can still pop up, but so far, so good. Tesla added yet another $1K to the price of Model Y over the weekend, and both deliveries and margins could well surprise to the high side.

Also remember that even if the share sale gets stretched out painfully long, at some point TSLA reaches a price where buyers just step in and buy enough to start the upward progression of the stock.

Consider how unpredictable the coming week could be. The most likely scenario is continued drift lower to 1000 as selling continues. Do we get a bounce not far below 1000 as we did on Wednesday of last week or do we head even lower? Do the hordes of buyers waiting for a bottom get antsy and start loading up sooner than expected?

In the meantime, you need to maintain your sanity during this slow band-aid pull. If you have some dry powder, you may wish to spread out your buying over several price points, making a point to not go completely all in until the recovery begins. You may lose an opportunity to be fully in when the rocket blasts off, but you will find some psychological advantage to being too late with part of the investment instead of being too early. If you lack dry powder, keep in mind that much craziness happens with this stock in the short term, but in the long run, auto deliveries and automotive margins are still the big factors affecting profitability and therefore share prices. This short-term craziness too shall pass.

News:
* Consumer Reports says Tesla is the most liked car brand in 2020
* Elon and Bernie Sanders have been jousting on Twitter on Sunday. Elon's statement, "Want me to sell more stock, Bernie? Just say the word" may negatively influence TSLA trading on Monday.

nov12treas.jpg

10 year treasury bond yields are at a palatable rate (below 1.6%)

nov12maxp.jpg

Max pain for this coming Friday is 1100. Market makers really don't want the price to spend much time below that 1000-strike wall of puts

nov13maxpvprice.jpg

Thanks again @JimS for this max pain vs. closing price chart. Check out how Monday's dip still remained above max pain but that ferocious Tuesday dip plunged the stock well below max pain.


nov12tech.jpg

Notice how the lows of last week congregated close to the mid bollinger band, with 1000 acting as support.

For the week, TSLA closed at 1033.42, down 188.67 from the previous Friday's 1222.09. That's the first weekly loss in 12 weeks. We're still up 353.08 over that time period. Hoping you had an enjoyable weekend. Life is good, even on TSLA down weeks.

Conditions:
* Dow up 179 (0.50%)
* NASDAQ up 157 (1.00%)
* SPY up 4 (0.75%)
* TSLA 1033.42, down 30.09 (2.83%)
* TSLA volume 25.2M shares
* Oil 80.79
* IV 61.9, 61%
* Max Pain 1100
 
Last edited:
nov15chart.jpg

TSLA chart above
nov15qqq.jpg

QQQ chart above

No big surprise we saw a deep Mandatory Morning Dip after market open. The stock price bottomed out around 980 then jumped back up higher in a move suggesting the dip was enhanced with short-selling. TSLA traded around 990, then 985 for an hour, but at 2:40pm it made a quick recovery to $1028 before a pushdown into close at $1013. If TSLA had remained near 990 or 985 for the close, I would have expected lower on Tuesday. Instead we saw a strong bounce in late afternoon. Twice now TSLA has bounced at this approx price point and a double-bottom might suggest a bottom.

Elon sold 934K shares on Monday. As @dl003 mentioned in this main investors' thread post, every time Elon adds 2.1M shares through his options he sells 934K shares.

In one Tweet today, the poster said "Hearing rumor circulating that Elon Musk might sell remaining $TSLA shares in a direct secondary rather than the open market." Chances are this is just a rumor, but it's a reminder how quickly the dip from Elon's sales could potentially turn around.

On Elon's Twitter account today, he spend a good amount of time posting replies to the original Bernie Sanders Tweet about rich paying their fair share and he engaged various other visitors to the thread. Judging by the responses, I think he's making headway in changing some views about his paying his fair share.

nov15treas.jpg

The 10 year bond yields continue to rise


nov15maxp.jpg

This Friday's max pain is now 970, a far cry from last week's 1100. Notice how puts dominate most strike prices and how low many of the puts are.

nov15tech.jpg

Looking at the tech chart, the similarities in the price at which TSLA bounced are noticeable.

Conditions:
* Dow down 13 (0.04%)
* NASDAQ down 7 (0.04%)
* SPY up 0 (0.03%)
* TSLA 1013.39, down 20.03 (1.94%)
* TSLA volume 34.1M shares
* Oil 80.88
* IV 60.7, 58%
* Max Pain 970
 
nov16chart.jpg

TSLA chart above
nov16qqq.jpg

QQQ chart above

On Tuesday the media credited rising EV stock prices as the reason for TSLA's positive day. Certainly that's part of the explanation: Rivian+15%, Lucid+24%, BYD+4%, Xpeng+5%. Personally, I think Rivian's big value is the result of Tesla's success and the other EV makers are feeling some of the updraft from Rivian's post-IPO rise. The big challenge, as Elon pointed out, is reaching volume production and profitability.

My take on TSLA's good day (up 4.08% on 26M shares traded) is a little boost from EV stocks, but most of the rise is the result of recent trends of the stock price. Twice now TSLA has descended to 990 or thereabouts and both times is has bounced substantially. Tuesday was a continuation of Monday afternoon's bounce. Potential buyers think, "dang, I missed sub-$1000 TSLA twice now, I'm not going to let the opportunity get away from me again." That's the psychology behind the double-bottom, I suspect. With TSLA at nearly 1055 now, that's a $65 gain over 990. Look at $65 as the downward risk and compare with the potential upward potential, and TSLA looks pretty good if you accept that 990ish is the bottom. In other words, Fear of Falling is decreasing while Fear of Missing Out is increasing. There are no certainties, of course. A big macro dip combined with a ferocious bear raid could change the equation. Nonetheless, TSLA rose 4% on a day when nearly a million of Elon's TSLA shares were sold.

According to this main investor thread post by @winfield100 , Elon acquired another tranche of 2.1 million shares (through options) on Tuesday and once again sold exactly 934,091 shares to pay for the taxes associated with the acquisition. Elon has now sold about 8.2 million shares.

News:
* Dave Lee provided an excellent series of Tweets on Tuesday to detail the extent of taxes that Elon will pay on his shares, both before and after his death. Elon Tweeted back, "Accurate thread" in response. Check out other comments by Twitter users and you can see that pro-Elon sentiment is growing on the tax issue (of course people who follow Dave Lee are typically pro-Elon, but the message Dave delivered was pretty much left alone by attackers).
* The UN fellow responded to Elon's Tweet about world hunger by laying out how a billionaire's $6.6 billion could be spent to provide hunger relief for one year. Here's a Business Insider article that of course distorts the end goal of Elon's comments by using the word "tackle" instead of "ending". The bottom line is that the UN sees no way to end world hunger for $6.6B. It would like the money to help in one year though. Elon has no obligation to pay up because the UN failed to adequately address Elon's challenge.

nov16treas.jpg

Yields on 10 year treasury bonds continue to rise. It's possible that we could see some market reaction before long, perhaps when the rates exceed 1.75%.

nov16maxp.jpg

Max pain remained at 970 Tuesday morning. Nonetheless, that huge mountain of puts at $1000 strike suggests to me that the market makers might be happy keeping TSLA above $1000 on the Friday close.

nov16tech.jpg

Looking at the tech chart, TSLA is climbing toward the mid-bollinger band. a climb above could reenable the mid-bb as support.

Conditions:
* Dow up 55 (0.15%)
* NASDAQ up 120 (0.76%)
* SPY up 2 (0.40%)
* TSLA 1054.73, up 41.34 (4.08%)
* TSLA volume 26.0M shares
* Oil 80.66
* IV 60.0, 57%
* Max Pain 970
 
nov17chart.jpg

TSLA chart above
nov17qqq.jpg

QQQ chart above

Wednesday's continued strength of TSLA suggests that yesterday's rise was more than just tagging along with other EV stocks. I'm sticking with my shift in Fear of Falling vs Fear of Missing Out perspective.

Nonetheless, on Nov. 9 Rivian had their IPO and TSLA fell 12%. On Wednesday, Rivian's momentum did a 180 and the stock lost 15%. TSLA gained over 3%. Hmm. I'm willing to tip my hat toward those who suggested part of Nov. 9th's big dip was caused by money flowing from TSLA to Rivian. Today was just the opposite as some Rivian money returned to TSLA.

Last I checked on TMC's main investor thread, there's no evidence of Elon selling on Wednesday. Hmm. Something is likely up if no selling took place because Wednesday was a strong day with the opportunity to sell a million shares or so without bothering the stock price too much.

I'm packing for a long-distant flight and my Thursday post will be brief and may be somewhat late. Nice to see TSLA exceed $1100 again, even for just part of the day.


nov17treas.jpg

Thank goodness the 10 yr treasury bond yield fell on Wednesday. The market is getting a bit worried.

nov17maxp.jpg

Max pain rose by $5 to 975 on Wednesday morning. I suspect we'll see another rise published on Thursday morning. What's interesting to note is that on Monday we saw puts rising above calls at most price points. Wednesday's max pain chart above shows calls dominating most strike points now. No doubt the change in option positions has resulted in market makers buying TSLA shares to remain delta-neutral.

nov17tech.jpg

TSLA closed above the mid bollinger band once again. Let's see if the mid-bb can serve as support again, if needed.

Conditions:
* Dow down 211 (0.58%)
* NASDAQ down 52 (0.33%)
* SPY down 1 (0.24%)
* TSLA 1089.01, up 34.28 (3.25%)
* TSLA volume 31.0M shares
* Oil 78.36
* IV 60.7, 58%
* Max Pain 975
 
nov18chart.jpg

TSLA chart above
nov18qqq.jpg


QQQ chart above

On Thursday I completed my long-distant flight and will make this a very short post without a great deal of research.

For TSLA's relative weakness in the afternoon (compared to the NASDAQ or QQQ) , the media will no doubt lay blame upon some news story of the day. They might be right or partially right, I just haven't had time to form much of an opinion. I can tell you, though, the media is not going to tell you that the weakness could have been caused by market maker manipulations as the week gets close to ending, and that's a very reasonable explanation in my book. If you look at the max pain chart, you'll see that 1100 is the real battleground as the week draws to a close, and there are lots of 1100-strike calls about to expire. Notice the TSLA chart and the tendency of TSLA to fairly quickly turn towards a dip any time the stock price exceeded 1100 on Thursday.


nov18treas.jpg
nov18treas.jpg

Another day of slightly lower 10 year treasury bond yields (above)_ will help the market relax just a bit about inflation

nov18maxp.jpg

Max pain climbed to 985 Thursday morning. We're starting to see more typical calls dominating at the higher strikes and puts dominating at the lower strikes, with the dividing line just below 1100. Because 1100 is working out to be the crux this week, and because there's over 17K 1100-strike calls expiring Friday, don't be surprised to see market makers working to get a close below 1100 on Friday afternoon.

nov18tech.jpg

On Wednesday TSLA closed above the mid bollinger band, which should have made the mid-bb a point of support for at least a day. TSLA closed on Thursday about $5 above the mid-bb.

Conditions:
* Dow down 60 (0.17%)
* NASDAQ up 72 (0.45%)
* SPY up 2 (0.34%)
* TSLA 1096.38, up 7.37 (0.68%)
* TSLA volume 20.7M shares
* Oil 79.01
* IV 62.0, 62%
* Max Pain 985
 
nov19chart.jpg

TSLA chart above
nov19qqq.jpg

QQQ chart above

What a week it's been. We began on Monday with sustained trading well below 990 for much of the day. Only as we approached the final hour did TSLA rally on high volume and generate the strong bounce that ended up exceeding the bounce of the previous week's Wednesday. As the week progressed, two things became apparent. First, this week's bounce was significant enough to suggest the "Elon is selling dip"'s bottom had likely already been hit. Second, as the week progressed and we saw no more Elon selling past Tuesday, potential buyers became nervous because the pattern of selling had been broken and the chance of emerging shorthanded from this TSLA dip became a serious concern. As the stock price climbed throughout the week, the pressure to buy continued to increase, which brings us to Friday.

Friday morning's trading was much of what you would expect. Market makers wanted TSLA to close below 1000 because of the significant number of calls at that price. TSLA remained below 1010 until a bit after 1pm, when the market makers lost control of the stock price. You can see the very significant volume increase that coincided with the price increase. TSLA managed to approach 1040 and even exceed that number after hours. I would credit the week's climb to a decrease in Fear Of Falling in investors after Monday's second bottom between 980 and 990 (each of which bottom was followed by a strong climb). The climbing stock price plus the lack of Elon selling after Tuesday simultaneously increase Fear Of Missing Out (FOMO) in the buyers. The net result is that TSLA needed to climb to reach an equilibrium between FOF and FOMO, again. Further climbing in Friday after-hours trading suggests the market makers were behind in their delta-hedging as market trading came to an end and needed to buy in after-hours to complete their buying. With Tesla continuing to execute well in Q4 (which is now more than halfway through), I suggest the FOMO pressure on buyers will continue.

As long as there is uncertainty about resumption of Elon's selling, there will be some upward pressure on the stock. Potential buyers are concerned because the stop in selling could mean: 1) a big bank assisted selling of shares directly to big clients is possible, which could skip many potential buyers, 2) Elon might know a reason why TSLA might increase in price in the near term, 3) the whole December 9 numerology teases might actually mean something that could move the stock. Remember that the beginning of production from Berlin and Austin Gigafactories is likely short weeks away, if that long. Tick, tick, tick. Of course if Elon started selling again as he previously did, sentiment could of course change to favor the buyers.

nov19treas.jpg

With yields on 10 year treasury bonds returning to the 1.5% area, the market will relax a bit about inflation, should the dip remain.

nov19maxp.jpg

Max pain going into the new week is 995.

nov19maxpweek.jpg

What's interesting about the max pain vs. closing price chart from @JimS is the relationship of price to max pain in both the dip week and the recovery week. In the dip week (11/8-11/12) the closing price fell quickly, which then dragged the max pain lower as the week progressed. In the recovery week, vastly lower max pains negatively affected TSLA on Monday but TSLA then climbed anyway and slowly helped pull max pain up with it. Compare this past week's climb to the 11/1-11/15 week climb and you can see how much more reluctant the max pain was this past week in responding to the stock price increases.

Coronavirus Update
nov19newcases.jpg

The downtrend in new cases after the Delta variant arrival has bottomed out, at least temporarily. Should there be a noticeable rise in new cases after Thanksgiving the market may get nervous, but with so many vaccines available in the U.S. fears of major economic shockwaves are probably not a major concern unless hospitals begin to overflow again.


nov19tech.jpg

Looking at the tech chart, you can see the double bottoms of below 990ish on Monday and below 990ish on the Wednesday of the previous week. Since Monday's bounce off the bottom, TSLA has been climbing every day of the week and has now returned to above the mid bollinger band. Thursday and Friday's volume was "only" about 21M shares, but it was enough to generate the buying pressure needed on Friday to break free of the market maker tractor beam and start climbing again.

For the week, TSLA closed at 1137.08, up 103.66 from the previous Friday's 1033.42. Hoping your weekend was a good one.

Conditions:
* Dow down 269 (0.75%)
* NASDAQ up 64 (0.40%)
* SPY down 1 (0.18%)
* TSLA 1137.06, up 40.68 (3.71%)
* TSLA volume 21.2M shares
* Oil 76.10
* IV 64.6, 69%
* Max Pain 995
 
Last edited:
nov22chart.jpg

TSLA chart above

nov22qqq.jpg

QQQ chart above

Monday morning saw TSLA briefly exceed 1200 before market forces with plenty of help from hedge funds, dipped TSLA briefly into the red. The stock then reversed course and climbed nearly to 1190 before the second pushdown of the day. Both the noon dip and the end of day dip were related to broader market dips, so let's take a look at the percentages to gain more insight. The noon dip for TSLA was a 5.7% change from morning high for TSLA but only a 1.7% dip for QQQ. For the end of day dip, TSLA's dip from afternoon high to closing was about 3% while QQQ's was 1.2%. Considering that TSLA was outperforming the NASDAQ and QQQ today, these excessive multiples on the TSLA dips suggests foul play by an entity selling the dips aggressively for some agenda. Otherwise, why would the TSLA noon dip look like a midwestern tornado when you see the recovery of the dip happen so dramatically, but nothing similar happened with QQQ.

That big plunge in the macros at end of day was supposedly caused by surging bond yields. Comparing Monday afternoon's yields to earlier last week, the climb doesn't justify the effects on the NASDAQ and QQQ.

Keep in mind that we are in one of the notoriously most manipulated weeks of the year. There's no trading on Thursday and reduced hours on Friday. I personally will just be riding it out and let the dust fall where it may. Q4 still looks good, and on Monday we received encouragement that both Berlin and Austin are on track to begin production before year end. Obviously, TSLA has been continuing its bounce since Monday of last week. No Elon selling took place on Monday (to my knowledge: I reference this site). Sentiment is still positive for TSLA but we'll just have to see how the manipulations of Thanksgiving week change that momentum.

Why am I so cynical? Just take a look at the 10 year treasury bond yield chart below. Notice that Friday's dip in yields looked mighty suspicious, like the yields had somehow stepped into the down elevator on Friday. Come Monday morning, the yields bounced back as if Friday never happened and then climbed. Notice the spike right around noon when TSLA spiked downward. Yes, it's possible that TSLA was just responding to the bond yields on Monday, but how can you explain that bizarre dip on Friday? Bottom line, try to avoid short-term bets because this casino isn't honest and please don't let some bizarre trading this week allow the pirates to pry TSLA shares away from you.

News:
* TorqueNews suggests Tesla may have as many as 3 million orders for the cybertruck now

nov22treas.jpg

Friday's dip in yields was strange, to say the least. Then on Monday that huge spike at noon looks manipulated. This must be Thanksgiving week! Would the hedge funds actually manipulate bond yields to achieve their goals with tech stocks? Methinks the answer is YES.

nov22maxp.jpg

Monday's max pain is 1050, that's 55 above Friday's. Notice the new spike in calls at 1050.

nov22tech.jpg

The "Elon is selling" dip is not V shaped because we had 2 bottoms on the way down.

Conditions:
* Dow up 17 (0.05%)
* NASDAQ down 203 (1.26%)
* SPY down 1 (0.28%)
* TSLA 1156.87, up 19.81 (1.74%)
* TSLA volume 32.9M shares
* Oil 76.75
* IV 66.3, 73%
* Max Pain 1050
 
Last edited:
nov23chart.jpg

TSLA chart above
nov23qqq.jpg

QQQ chart above

The market on Tuesday decided to have a conniption about inflation yet again, which is leading to downward pressure on tech stocks. TSLA gets lumped in with these high flyers. For comparison sakes, Nvidia was down 0.66% and Apple was actually up 0.24%. The ETF that gives us a good handle on high flying tech stocks is ARKK, which was down 2.33% on Tuesday. Thus, I look at TSLA's dip of over 4% as being overplayed and a typical casualty of Thanksgiving week mischief by the option sellers. With max pain at 1100, you can see there's incentive for this kind of a dip.

Elon sold his usual 943,091 shares again today, well less than 3% of TSLA trading for the day. If you want to see what really caused the big dip, though, consider this Tweet from Tesla Facts:

nov23tf1.jpg


TSLA volume was 36M shares, definitely on the high side. The good news is that this big bear raid of puts will expire on Friday.

nov23treas.jpg

Although Monday's rise in bond yields appeared to be somewhat gamed, due to Friday's miraculous dip, Tuesday's further climb in bond yields increases the downward pressure on tech stocks.


nov23maxp.jpg


Max pain increased to 1100 on Tuesday morning. Notice the growing put mountains at 1050 and 1100. According to Tesla Truth on Twitter, over 80K new put positions were opened on Monday. we don't see the correspondingly strong increase in call positions, however, and so the put buying places downward pressure on the stock price as market makers sell TSLA shares to delta hedge.

nov23tech.jpg

Saved by the mid-bollinger band again. This support level often works once and then softens until it is reset during yet another climb.

Conditions:
* Dow up 195 (0.55%)
* NASDAQ down 80 (0.50%)
* SPY up 1 (0.13%)
* TSLA 1109.03, down 47.84 (4.14%)
* TSLA volume 36.1M shares
* Oil 78.50
* IV 72.0, 80%
* Max Pain 1100
 
nov24chart.jpg

TSLA chart above
nov24qqq.jpg

QQQ chart above
Wednesday's trading began with a dip on steroids and ended with the work of a pickpocket.

Leading into Wednesday's open, QQQ dipped and bottomed out 15 minutes after market open for a dip of 1%. Meanwhile, TSLA experienced an overblown version of the dip and bottomed out just a few minutes after market open with a dip of 4%, which is unjustified in a no news of consequence environment. When the broader market started recovering, TSLA beat it to the recovery and climbed into the green within 30 minutes of open. Although some investors will respond to fear of falling, the super-quick recovery suggests that right now Fear Of Missing Out may still be a stronger sentiment. Another factor was that TSLA bottomed out $36 below max pain and it'd be in the market makers' best interest to encourage a recovery.

If you compare Wednesday's max pain chart to Tuesday's, you will see a reduction in the significant numbers of puts as we near the week's end. Time value also decreases dramatically on weekly options as we need the end of the week. This is one of the shortcomings of using weekly puts to generate a negative gamma squeeze.

TSLA showed somewhat similar rises and falls (but at higher multiples and with an overall more positive performance) than QQQ and NASDAQ on Wednesday. One of the biggest departures from the broader index trading was the sizeable dip TSLA took half an hour before close. Neither QQQ nor NASDAQ show this same dip, nor do most tech-like stocks. No negative TSLA news stories of significance broke in this timeframe. I surmise that volume was light enough to enable the market makers or hedge funds to lift $12 from our pockets and lower TSLA's price to just $16 above max pain, a more advantageous price for beginning Friday's short trading day if you are a market maker or hedge fund short TSLA. I like to equate the fairly frequent pushdowns into close that we see at TSLA as the work of a pickpocket.

Keep in mind that this whole week has a reputation for being manipulation-rich in many prior years. It'll be good to get to next week.

Trading closes at 1pm on Friday.

News:
* Futures are down, some say because of this new Covid variant.
* Giga Shanghai will be expanding enough to utilize another 4,000 employees

nov24treas.jpg

A decrease in the 10 year treasury bond yields on Tuesday might take away some of the overreaction to the recent hike

nov24maxp.jpg

Max pain is at 1100 as of Wednesday morning. At that price point the puts greatly outnumber the calls, so the obvious play of the market makers on Friday would be to engineer a close close to but pennies below 1100. Since Friday should be a low volume day (Wall Street types are still up in the Hamptons with their families) and a short trading day, manipulations are much easier than normal. With futures looking deep red on Thursday evening, the hedge funds may prevail and get a noticeably deeper dip on Friday than the market makers would prefer.

nov24tech.jpg

TSLA closed within about $2 of the mid bollinger band on Wednesday. In the past two weeks the mid bb has been the focus point for both rises and falls of the stock.

Conditions:
* Dow down 9 (0.03%)
* NASDAQ up 70 (0.44%)
* SPY up 1 (0.27%)
* TSLA 1116.00, up 6.97 (0.63%)
* TSLA volume 22.4M shares
* Oil 78.39
* IV 67.7, 75%
* Max Pain 1100
 
Last edited:
nov26chart.jpg

TSLA chart above
nov26qqq.jpg

QQQ chart above

On Friday we had a chance to see how the market would react to news of the new Omicron strain of coronavirus. Indexes fell significantly, with some showing the biggest one day loss of the year. The news easily brought TSLA down to its Friday morning max pain number of 1095, and the stock spent most of the short trading day gyrating close to that number. Since the NASDAQ fell 2.23% on Friday and 1095 represented only about a 1.9% dip for TSLA, which is about half of what you would expect on a big negative macro day. I attribute TSLA's relative strength to a little help from market makers. Alas, the NASDAQ and QQQ dipped going into the close and TSLA followed (market makers weren't going to be able to engineer a close pennies above 1100 but they could easily hold TSLA above the next crowded put strike, 1050).

Omicron variation
Initial word of this variation was alarming: it spreads extremely quickly and is so significantly mutated that existing vaccines may not offer protection against it. Thus the big macro dip on Friday.

Over the weekend we heard the other side of the story. Viral counts is waste water in South Africa are way up but we're not seeing the large number of people with symptoms (could simply mean that virus spreads very quickly, however). Anecdotal evidence so far pointed toward the variant being more benign than other versions of coronavirus. Thus futures are up on Sunday night.

The truth of the matter is that more time is needed to get a better handle on the seriousness of this new variant. Don't be surprised to see volatility in the markets as new data swings opinions one way or the other.

News:
* Elon Tweeted that Tesla is moving forward with the earlier plan to start unwinding the wave. Employees are instructed to avoid spending extra money to move deliveries into Q4. Although this approach will lead to better containment and no real change in deliveries over time, in the short term we will see Q4 with a few thousand deliveries less than otherwise. This is not such a bad deal for investors because costs will go down somewhat and margins up. My feeling is that Q4 is looking strong enough right now that market reaction should be light.
* Bloomberg says Tesla Berlin aiming for 1,000 vehicles/wk in January, 30K in first half of 2022. @The Accountant thinks that latter number should be more like 45K.

nov26treas.jpg

I will take Friday's big drop in treasury yields with a grain of salt. If on Monday the yields jump higher and the pundits are claiming a huge increase in one day, I will think "same old game".


nov26maxp.jpg

Last Friday's Max Pain was 1095, which TSLA came within 13 of hitting. For the coming week, what you'll notice on the chart above is how dominant Puts are. The Max Pain site says coming into the new week we have a 2.66 put-to-call ratio. It's typical to see somewhat more puts than calls, but this ration is really unusual in how unbalanced it is. If the macros open strong and TSLA does too, expect call buying, which would cause the market makers to buy in order to delta-hedge.

nov26.jpg

Thanks again to @JimS for this comparison chart between max pain and closing price. Notice in strong up weeks how the max pain chart chases but seldom catdches the stock price. OTOH, in dip weeks the relationship is reversed. This past week saw the two coming together, which finally gave the market makers a fighting chance to tweek price to match max pain, but volatility prevented that move in the final hour of trading on Friday.


nov26tech.jpg

For months, TSLA followed tthe upper bollinger band (or the band followed the stock price), but now we've seen two weeks plus in which the stock price has been gyrating around the mid bollinger band.

For the week, TSLA closed at 1081.92 down 55.16 from the previous Friday's close of 1137.08. We're nearly two-thirds of the way through Q4, which looks like another strong quarter. Hoping you enjoyed a great weekend.


Conditions:
* Dow down 905 (2.53%)
* NASDAQ down 354 (2.23%)
* SPY down 11 (2.23%)
* TSLA 1081.92, down 34.08 (3.05%)
* TSLA volume 11.4M shares
* Oil 68.15
* IV 71.3, 80%
* Max Pain 1095
 
nov29chart.jpg

TSLA chart above
nov29qqq.jpg

QQQ chart above

Monday was indeed the flip side of Friday's overreaction to fears of the Omicron variant of coronavirus. We saw NASDAQ dip 2.23% on Friday and then climb 1.88% on Monday, erasing most of Friday's losses. As for TSLA, with a little help from the market makers, TSLA dipped "only" 3.05% on Friday but rose 5.09% on Monday, for a net gain of more than 2%.

Monday night futures are down for all exchanges, reportedly because Moderna's CEO said their vaccine's effectiveness will likely drop against the new variant. Try not to get whiplash as the pundits pontificate about the variant as more news comes forth. Fortunately, 10 year treasury bond yields were near 1.5% for a second day in a row (see chart below), which will help high flying tech-like stocks. Thus although I'm looking at Dow futures down 1.36%, NASDAQ futures are down only 0.44% at time of writing.

News:
* Thanks @Curt Renz for posting in the main investor thread that two foreign analysts have just offered TSLA price targets approaching $1500.
* Giga Texas permits have apparently been approved
* Dave Lee in his podcast explains why he thinks Elon's Tweet about unwinding the end of quarter delivery rush is a hint of another blowout quarter coming

The big question for Tuesday is whether Elon will resume selling shares. The market has been punishing TSLA inappropriately hard for recent small sales by Elon.

nov29treas.jpg

For the second business day in a row, 10 year treasury bond yields hovered near 1.5%. This could be part of the explanation for strong tech stocks on Monday.

nov29maxp3.jpg

Max pain Monday morning was 1100 and is still 1100 after Monday's trading (Monday night was the first night I discovered updated max pain chart has been published without having to wait until morning). Looking at the chart, the dividing line between domination by calls and domination by puts is right around 1120. The put to call ratio fell from about 2.66-to-1 to 2.49-to-1 after Monday's trading. The change suggests more call buying than put buying and would likely mean some of the rise in price on Monday was caused by market maker delta-hedging.


nov29tech.jpg

TSLA has once again risen above the mid-bollinger band. Should the price remain near the mid-bb (with temporary excursions) the market makers will continue to rake in the profits.

Conditions:
* Dow up 237 (0.68%)
* NASDAQ up 291 (1.88%)
* SPY up 6 (1.23%)
* TSLA 1136.99, up 55.07 (5.09%)
* TSLA volume 18.9M shares
* Oil 70.55
* IV 63.8, 67%
* Max Pain 1100
 
nov30chart.jpg

TSLA chart above
nov30qqq.jpg

QQQ chart above

Consider the last three trading days for TSLA:
Friday- TSLA fell 0.82 more than the NASDAQ but the multiplier of TSLA's dip was only about 1.35X, noticeably better than with a typical macro dip
Monday- TSLA climb over 5% on Monday, climbing 2.7X the climb of the NASDAQ
Tuesday- The NASDAQ dipped (worries about Omicron and about Powell's position flip that inflation is not just transitory) and lost 1.55%. TSLA, OTOH, climbed 0.68%, for a performance advantage of 2.23%
Conclusion: TSLA is trading on strength right now. Possible reasons: 1) Market is relaxing about Elon's selling as it is being spread out far enough to allow the stock to climb now, and 2) Both Giga Berlin and Giga Texas likely opening within next two weeks, 3) Q4 appears ready to continue trend of leapfrogging previous quarters and exceeding analyst expectations.

TSLA notes: the apparent whack-the-mole maneuver for TSLA on Tuesday could be because market makers wish to minimize TSLA's gains this week, since it is already nearly $40 above max pain. Typically you see the manipulators try for a late afternoon pushdown into close in a situation such as this, but instead TSLA climbed into the close.

No Elon selling was observed on Tuesday.

nov30treas.jpg

Wow, the 10 year treasury bond yields decreased below 1.5% on Tuesday. Again, this helps high growth companies.

nov30maxp.jpg

Max pain crept up to 1105 on Tuesday. Market makers would prefer to not pay the call hills at 1150 and 1160 and so expect some resistance as the stock moves toward these numbers. OTOH, Tesla had both strength and higher than normal volume on Tuesday, so the market makers may not be able to succeed in blocking this movement.


nov30tech.jpg

Check out how Tuesday's low was a bounce off the mid-bollinger band. Since early November, the mid-bb has risen nearly $100. Now you can see that the bollinger bands are about level. Hopefully we'll soon get a run higher toward the upper bollinger band again because hovering near the mid-bb is no longer a climb opportunity for the stock.

Conditions:
* Dow down 652 (1.86%)
* NASDAQ down 245 (1.55%)
* SPY down 9 (1.95%)
* TSLA 1144.76, up 7.77 (0.68%)
* TSLA volume 25.3M shares
* Oil 66.18
* IV 65.3, 72%
* Max Pain 1105
 
dec1chart.jpg

TSLA chart above


dec1qqq.jpg

QQQ chart above

Major indexes sank Wednesday afternoon as word came out that the first case of Omicron coronavirus had been reported in California. This afternoon's dip was the "it's here!" overreaction. Futures are up for Thursday, however, and rest assured that the hedge funds and market makers will not only benefit from the whipsaw volatility over Omicron, they will at times contribute to it.

NASDAQ closed down 1.83%, about 2.5X less than TSLA's drop of 4.35%. A 2.5X multiplier isn't that out of the ordinary for TSLA on a down macro day, but considering the recent strength of TSLA vs. the NASDAQ, today's dip seemed rather strange. OTOH, consider that ARKK, which is a large ETF of high-flyers, lost 6.71% on Thursday. NVIDIA was down nearly 4%, so it appears TSLA's plunge was more sector-related than specific to the stock.

Volatility often works well for market makers because they can either hold back or enhance the move up or down without others catching on. In weeks when you have big moves in both directions the setup is all the better. TSLA's most recent max pain was 1115 and a 1095 closing price brings TSLA much closer to max pain. If we see a 50% rebound with TSLA on Thursday from Wednesday's dip, TSLA could go into Friday's trading at very close to max pain. Hmm.

Both QQQ and TSLA showed recovery during after hours but TSLA's improvement was more pronounced.

Early reports of the Omicron variant typically mention light symptoms. One speculation is that if the variant is highly contagious but doesn't produce nearly the negative symptoms as other versions of Covid, a far less lethal version of Covid becoming the predominant strain could actually be a good thing, especially if the vaccines provide a significant level of protection. That said, we lack data on the variant and will just have to give it some time before we get a better handle. May I suggest that "the sky is falling" is not a satisfactory reaction from an astute investor in the meantime, however.

dec1treas.jpg

Meanwhile, 10 year treasury bond yields continue to fall

dec1maxp.jpg

With a bunch of puts at 1100, market makers will want TSLA closing above that price on Friday but would prefer a close below 1150 and 1160

dec1tech.jpg

TSLA will have to climb above 1112 to get on the "good" side of the mid-bollinger band again.

Conditions:
* Dow down 462 (1.34%)
* NASDAQ down 284 (1.83%)
* SPY down 5 (1.11%)
* TSLA 1095.00, down 49.76 (4.35%)
* TSLA volume 22.94M shares
* Oil 66.80
* IV 70.5, 80%
* Max Pain 1115
 
Last edited by a moderator:
View attachment 739676
TSLA chart above


View attachment 739678
QQQ chart above

Major indexes sank Wednesday afternoon as word came out that the first case of Omicron coronavirus had been reported in California. This afternoon's dip was the "it's here!" overreaction. Futures are up for Thursday, however, and rest assured that the hedge funds and market makers will not only benefit from the whipsaw volatility over Omicron, they will at times contribute to it.

NASDAQ closed down 1.83%, about 2.5X less than TSLA's drop of 4.35%. A 2.5X multiplier isn't that out of the ordinary for TSLA on a down macro day, but considering the recent strength of TSLA vs. the NASDAQ, today's dip seemed rather strange. OTOH, consider that ARKK, which is a large ETF of high-flyers, lost 6.71% on Thursday. NVIDIA was down nearly 4%, so it appears TSLA's plunge was more sector-related than specific to the stock.

Volatility often works well for market makers because they can either hold back or enhance the move up or down without others catching on. In weeks when you have big moves in both directions the setup is all the better. TSLA's most recent max pain was 1115 and a 1095 closing price brings TSLA much closer to max pain. If we see a 50% rebound with TSLA on Thursday from Wednesday's dip, TSLA could go into Friday's trading at very close to max pain. Hmm.

Both QQQ and TSLA showed recovery during after hours but TSLA's improvement was more pronounced.

Early reports of the Omicron variant typically mention light symptoms. One speculation is that if the variant is highly contagious but doesn't produce nearly the negative symptoms as other versions of Covid, a far less lethal version of Covid becoming the predominant strain could actually be a good thing, especially if the vaccines provide a significant level of protection. That said, we lack data on the variant and will just have to give it some time before we get a better handle. May I suggest that "the sky is falling" is not a satisfactory reaction from an astute investor in the meantime, however.

View attachment 739680
Meanwhile, 10 year treasury bond yields continue to fall

View attachment 739677
With a bunch of puts at 1100, market makers will want TSLA closing above that price on Friday but would prefer a close below 1150 and 1160

View attachment 739679
TSLA will have to climb above 1112 to get on the "good" side of the mid-bollinger band again.

Conditions:
* Dow down 462 (1.34%)
* NASDAQ down 284 (1.83%)
* SPY down 5 (1.11%)
* TSLA 1095.00, down 49.76 (4.35%)
* TSLA volume 22.94M shares
* Oil 22.5
* IV 70.5, 80%
* Max Pain 1115
Thanks for the great coverage. Note: Your Oil figure shows a typo. Cheers

Mod edit: Thanks for helping to maintain the correctness of the thread. What would normally happen is either Peter or one of the mods would correct the posting and we'd then delete this one. But you didn't say what you thought it should be, and I don't remember what he uses as his source. WTI was $62.05 yesterday according to my search. But for anyone posting corrections, please be helpful by telling us what you think the right answer is.
--ggr
 
Last edited by a moderator:
Thanks all on the oil price catch. I use oilprice.com west Texas as my source. The number was put up by my assistant and I didn't catch the error.

If a mod could change the number to 66.80, it would be appreciated.
Mod: Done. I'll leave these messages for a couple of days so people see them, then delete them. --ggr
 
dec2chart.jpg

TSLA chart above
dec2qqq.jpg

QQQ chart above

On Thursday macros did well, tech sector did well, Tesla news was very good, and Tesla significantly underperformed the market. This was either a major manipulation or Elon was selling shares. It turns out it was the latter, with Tesla's CEO selling about a billion dollars worth. Elon was selling a bit less than a million shares on a day with TSLA volume of 24 million. One member on TMC calculated he's now sold about 62% of the shares needed to equal a trimming of 10%. This too will come to an end in good time.

In the meantime, the good news continues to focus on Tesla's Shanghai factory, which is performing like a well-oiled machine these days. From the Tweet below (thanks to @elasalle for posting the Tweet here) you can see that China sales are well ahead of 2nd month of quarters in the past. Combine the domestic sales in November with the high number of sailings from China that month and Q4 continues to look strong.
dec2china.jpg

So, with Elon's stock sale out of the way for the week and with good news that wasn't positively affecting the stock price on Thursday, Friday looks like it could be a positive day. Max pain was at 1120 on Thursday, but I think the market makers are mostly going to be concerned about getting a few pennies above 1100 at close so that the approx 12K puts at 1100 expire worthless.

dec2treas.jpg

Treasury bond yields continue below 1.5%

dec2maxp.jpg

Forget the big put mountains at 920, 950, and 1000. The one that's likely to be in play for Friday is the 1100 peak.


dec2tech.jpg

Looking at the tech chart, so much of the trading in the past couple weeks has been below the mid bollinger band that you're seeing the bollinger bands starting a downward turn. I wouldn't be too worried as we're now in the final month of what looks to be yet another record-breaking quarter. I suspect enough traders will buy call options as December progresses that it will force the market makers to push the stock price higher through their delta-hedging.

Conditions:
* Dow up 618 (1.82%)
* NASDAQ up 127 (0.83%)
* SPY up 7 (1.53%)
* TSLA 1084.60, down 10.40 (0.95%)
* TSLA volume 24.2M shares
* Oil 66.50
* IV 71.7, 82%
* Max Pain 1120
 
dec3chart.jpg

TSLA (market hours) chart above

dec3qqq.jpg

QQQ chart above

What a week. On Tuesday TSLA looked well on its way to 1200 again. Alas, Fears of Omicron rekindled and (more importantly) Fed Chairman Powell after spending months reassuring the market that inflation was merely transitory, suggested it now might be here for quite a bit longer. The market was not happy, particularly with the highest flying tech stocks, and so we saw lots of downward pressure on TSLA during the second part of the week. Elon decided to sell another billion worth of shares to mostly pay taxes on his new shares. @Artful Dodger pointed out in the main investors' thread that Dec 3 (Friday) was the reference date for rebalancing the S&P 500. Hmm. Sugar happens and can't typically be predicted.

Despite the macro woes, TSLA continues to look good for Q4 as two major factories prepare to open at a time of unprecedented demand.

dec3treas.jpg

So, what's with inflation expected to force interest rates higher and yet we see 10 year bond yields continuing to drop? We're seeing the fear response of Omicron worry pushing money into bonds, which bids the price up and lowers the yields.

dec3maxp.jpg

Max pain is at 1100 as we start the new week. You can see put hills interspersed between the call hills up until we get to 1200 and above. Put to call ratio is a high of nearly 3.3. All of that put buying on Friday undoubtedly caused market makers to sell in order to delta hedge.

Coronavirus Update

dec3newcases.jpg

As expected, the Thanksgiving holiday has led to a bump in Covid 19 cases in the U.S. Given the likely higher transmittal rate of the Omicron variant, we should expect the chart to show a growing hill as Omicron (already detected in 9 states) spreads. The media, of course, focuses on the negative (high transmittal rate) yet refrains from balancing the story with reports from South Africa that the variant is not producing (yet, at least) significant numbers of life-threatening symptoms in vaccinated individuals. More time is obviously needed before the medical community can confidently speak of Omicron's dangers, and so the public receives what may well be a more dire impression of the Omicron threat than we'll conclude at a later date (transmittal rate easier to assess at the moment than long-term threat to those infected). As I said before, expect continued market volatility as the details emerge. A rapidly-spreading variant with only mild to moderate symptoms that becomes the predominant strain is not necessarily a bad thing.

dec3maxpweeks.jpg

In the last two weeks we saw Thursday closes which suggested market makers could nail the max pain number on Friday, if they wanted. Instead, we saw NASDAQ dips of 2.23% and 1.92%, on the respective Fridays and deeper TSLA dips. Yep, the benign TSLA dip on final Friday in November actually had a bigger NASDAQ dip than the 6.42% TSLA dip this past Friday. Looking at various stocks, it looks like the highest of the high-flyers (TSLA, NVIDIA, ARKK, etc.) were hit hard this past Friday while many of the other NASDAQ stocks were not. I believe interest rate and inflation worries are the core reason.


dec3tech.jpg

Looking at the tech chart, Friday's plunge stopped short of the lower bollinger band and the 50 day moving average. I would be inclined to believe we have good support in the 988-981 region for this reason, if needed. If you look at previous dips in November, we saw bounces in the vicinity of 1000 to 980.

Overall, Q4 continues to look very good. No doubt some sketchy characters on Wall Street would just love to scare TSLA shares from impressionable retail longs at these low prices so that they can hold those shares through the opening of two factories (Berlin and Texas) plus enjoy the market response should Q4 Production and Deliveries and the Earnings Report once again set new highs and astound the analysts. Not only am I determined to not sell the pirates any shares, I picked up two leaps on Friday late afternoon. The time to buy leaps, in my book, is when you perceive to be close to the bottom of a dip and see much better times ahead. It should be somewhat scary when you buy. Sometimes I guess wrong and the stock has more down in store, but since it was a leap with an In The Money or reasonable strike price (with at least a year before expiration) I just sit it out and Tesla manages to deliver a profit to the trade all the same.

For the week, TSLA closed at 1014.97, down 66.95 from the previous Friday's 1081.92. Better days lie ahead. Hoping you enjoyed your weekend.

Looking forward to the coming week. We at last get to find out what, if anything, transpires on 12/9.

Conditions:
* Dow down 60 (0.17%)
* NASDAQ down 296 (1.92%)
* SPY down 4 (0.87%)
* TSLA 1014.97, down 69.63 (6.42%)
* TSLA volume 30.5M shares
* Oil 66.26
* IV 76.9, 89%
* Max Pain 1100
 
Last edited: