For the 8 months or so of the four years I have owned my 2019 M2 SR+, I have experienced less regenerative braking and an energy bar display that no longer fills green left of the "D", regardless of temperatures, miles driven on the trip, whether I charged at home or at a supercharger. Is anyone else experiencing this? Thanks.


Welcome to Tesla Motors Club
Discuss Tesla's Model S, Model 3, Model X, Model Y, Cybertruck, Roadster and More.
Register
Install the app
How to install the app on iOS
You can install our site as a web app on your iOS device by utilizing the Add to Home Screen feature in Safari. Please see this thread for more details on this.
Note: This feature may not be available in some browsers.
-
Want to remove ads? Register an account and login to see fewer ads, and become a Supporting Member to remove almost all ads.
You are using an out of date browser. It may not display this or other websites correctly.
You should upgrade or use an alternative browser.
You should upgrade or use an alternative browser.
Regenerative Braking Display/Performance
- Thread starter sq.in.
- Start date

GtiMart
Active Member
Regen braking power seems to have been lessened for everyone a few months back. Are you saying that the bar does not completely fill anymore, or that you are not getting any green at all to the left side?
Regen is also affected by battery temperature but since you've had the car for 3+ years I presume you've driven it in winter before so you know this.
Regen is also affected by battery temperature but since you've had the car for 3+ years I presume you've driven it in winter before so you know this.
Yeah, the regen braking has been less pronounced and the dots never totally fill all the way to the left regardless of battery temp or speed while braking. Tesla said this is the new graphic norm and that nobody’s energy bar fills all the way to the left anymore.
derotam
Active Member
That’s simply not true. Also, are you saying that your regen bar never goes left of the “D”?
My stand by my words of "The green regen bar has never maxed out to the left side." when read litterally which is how they were meant to be read back in March. The green Regen bar has never maxxed FULLY and COMPLETELY ALL the way to the left completely filling the static displayed light grey power bar.
As far as it going past the D. It might, I can't recall that exact detail at this time and looking at a screenshot of a Model 3 display doesn't help me. Right this second I would say that it may or may not go past the D, but I think with you coming back to this almost 3 months later lets ask some more questions.
Are YOU saying that you see(still) the green regen bar go up to the D and stop there, or are you saying that it is stopping before the D. Can you get a picture taken of the screen during a full regen instance to post so we can see what you are seeing?
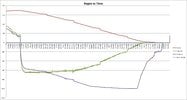
By the way, here is a graph from 2019 of regen power from a 2018 LR RWD. I will try and get a current data set and will post that graph when I get it. I agree that it seems that MAX regen has been reduced a bit over time but I don't think it is much and the curve has probably been adjusted slightly as well.
Attachments
Last edited:
derotam
Active Member
That’s simply not true. Also, are you saying that your regen bar never goes left of the “D”?
Ok so update... First, I will continue to stand by my statement that the green regen bar does not(and has not in the past) go past the "D". I will say however that that does not mean that in some unknown cases like AEB that it couldn't go past the D as the limits and scaling is all up to Tesla and can change at any time.
Second, looking at a new data capture for regenerative braking specifically in the case of a 70-0mph regen, it doesn't look like there has been a "reduction" as "felt" by many people on here. What the feeling might be is the beginning of the regen curve changing.
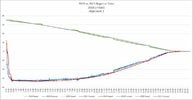
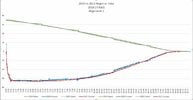
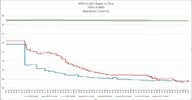
Following are three graphs. The first shows the full 70-0mph regen curve. The second graph I pulled the 2023 data over to try and align the beginning bottom of the power curve. The third graph zooms in on the beginning of the curve from the first graph. For the data I aligned the beginning of the regen to where the R Power has a defined drop(for 2019 data it went from 17kW to -29kW instantly, for 2023 it went from +24.5kW to +19, +17.5, +15, +10.5, +8, +5.5 within 8ms. So I aligned the 2019 +17kW to the 2023 +24.5kW.
Test methodology: 2023, I got up to speed manually then immediately and full let my foot off the accelerator. 2019 either the same as 2023 OR was on cruise control and then disengaged. 2019 SOC was 66%, 2023 SOC was 44%.
Analysis of curve differences: It looks like the regen curve is a bit more smooth in 2023 and looks like it actually stays a bit lower(~2kW) for longer before it starts to converge starting at about 15mph.
Analysis of "reduced regen" sentiment: From this specific data alone it looks like what people MAY be feeling is a change in the beginning of the regen curve when you first let off the accelerator. Obviously there could be differences between RWD and AWD(though I think that is unlikely for the most part).
Methodology changes and effect on data: I don't believe that any changes in test methodology would change the conclusions or would significantly change the gross data patterns. I will probably run this test a couple more times specifically to see if there is a difference between letting off the accelerator vs disengaging AP. Disengaging AP is the wild card because that sequence is more likely to have undergone a more significant change over time.
Summary: Based on the comparison between my 2019 and 2023 regen data, there isn't a decrease in overall regen when doing a 70-0mph regen test. The feeling of reduced regen is likely due to a change in the beginning of the regen curve as shown in this data.
Attachments
ewoodrick
Well-Known Member
If I remember correctly, the car now allows for more regen than previously. And I think that the fudged the display a little because it was confusing people.
While it is no longer cold, it's not as obvious, but if you take the car to near 100% charge, you should see it.
While it is no longer cold, it's not as obvious, but if you take the car to near 100% charge, you should see it.
derotam
Active Member
If I remember correctly, the car now allows for more regen than previously. And I think that the fudged the display a little because it was confusing people.
While it is no longer cold, it's not as obvious, but if you take the car to near 100% charge, you should see it.
Yeah, that was the other question I have seen around. I am planning on running a series of tests for Regen vs time at different SOC's. It is a pretty easy test to do and minor road elevation changes shouldn't have a huge affect. I also want to do regen vs time at different speeds mainly to look at the beginning of the regen curve.
ewoodrick
Well-Known Member
When you abruptly take your foot off the accelerator do you passengers get thrust forward and complain? If so, regen it working.
More than likely, you are just getting used to it. You are learning to modulate the accelerator.
But if you take your foot completely off the accelerator at 55mph and you are lunged forward, then it is working.
More than likely, you are just getting used to it. You are learning to modulate the accelerator.
But if you take your foot completely off the accelerator at 55mph and you are lunged forward, then it is working.
derotam
Active Member
Just wanted to make an update even though I haven't been able to capture it in SMT yet.
So it looks like Driver initiated regen is mimitef from max available. I don't think there was much of and argument there. That limit on the energy bar looks like it is around the "D".
AP initiated regen will go past the "D" WITHOUT physical brakes. This is a pending observation based on visual and physical cues and limited from a data acquisition standpoint because SMT is not registering brake pedal activation in any circumstance right now(at least for me).
My current regen limit for user initiated is around 65kW. I just saw it go to at least 72kW in an AP regen scenario before the brakes activated which then drops(based on visual cues) regen way down.
Data still to be collected.
Similar threads
- Replies
- 2
- Views
- 342
- Replies
- 3
- Views
- 316
- Replies
- 8
- Views
- 453
- Replies
- 7
- Views
- 718
- Replies
- 5
- Views
- 783