


Welcome to Tesla Motors Club
Discuss Tesla's Model S, Model 3, Model X, Model Y, Cybertruck, Roadster and More.
Register
Install the app
How to install the app on iOS
You can install our site as a web app on your iOS device by utilizing the Add to Home Screen feature in Safari. Please see this thread for more details on this.
Note: This feature may not be available in some browsers.
-
Want to remove ads? Register an account and login to see fewer ads, and become a Supporting Member to remove almost all ads.
You are using an out of date browser. It may not display this or other websites correctly.
You should upgrade or use an alternative browser.
You should upgrade or use an alternative browser.
Software v21.31.0
- Thread starter m3-pw2
- Start date
wjgjr
Active Member
I just got that as well - I assume it was a rollout planned before this. I am noticing a different behavior today with my PWs, which are in backup-only mode. Previously, it would do a larger draw from solar every day or two to charge them back to around 98%. However, as of today they are charged to 100% (no storm watch here) and it is frequently (looks like 6 times in 4 hours) showing small pulls as if it is attempting to maintain 100%. Not sure why the change, and I guess I will see if that behavior persists.

eml2
Member
I am still in Storm Watch, but it also seems to have changed behavior and now trickle charging to keep it at 100%. Not sure if this is temporary after software upgrade while battery re-calibrates or it will be a permanent change.I just got that as well - I assume it was a rollout planned before this. I am noticing a different behavior today with my PWs, which are in backup-only mode. Previously, it would do a larger draw from solar every day or two to charge them back to around 98%. However, as of today they are charged to 100% (no storm watch here) and it is frequently (looks like 6 times in 4 hours) showing small pulls as if it is attempting to maintain 100%. Not sure why the change, and I guess I will see if that behavior persists.
It also changed the icon for the powerwall on the Web UI. Now it looks like it has been chopped in half. Is it supposed to look like a Powerwall+? But I don't have it.
I've been on 21.24.2 for a couple of weeks now.. not sure what the changelog is, but, yes, my web GUI has the same shrunken powerwall display:
EVRider-FL
Active Member
I recently had Powerwalls installed and didn’t know there was a web UI. How do you access that?
Here is teslas information on how to access your powerwall gateway locally:

Connecting to Tesla Gateway and Powerwall+ | Tesla Support
If you lose internet or cellular connection, view instructions on how you can monitor your system’s power flow and charge level via web browser by connecting to your Gateway or Powerwall+.
Not sure how this might or might not be impacted by powerwall+ though, as its the tesla gateway you access, not the powerwalls directly.
EVRider-FL
Active Member
Thanks for the link to the article. I was able to connect, but apparently I have to connect to the Gateway’s WiFi whenever I want to monitor, is that right? As long as the Tesla app is working, not sure when I would do that.
Thanks for the link to the article. I was able to connect, but apparently I have to connect to the Gateway’s WiFi whenever I want to monitor, is that right? As long as the Tesla app is working, not sure when I would do that.
The reason that is there (for the most part) is so that you dont have to have internet to monitor. If (for example) you were in an outage situation and did not have internet, if you dont have cellular active on your gateway or are out of range etc etc, you can still log on and monitor your own equipment locally.
There isnt a lot you can do there other than look, but it gives you a way to look without the tesla app.
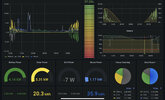
While there isn’t much to look at in that interface there is a lot of API data available, so I use the API data for better graphs/reporting, you can also see in the battery graph by the vertical dotted red and green lines when it stopped received data during the upgrade to 21.31.0, in the graphs on the right side the top one also shows the solar altitude in percent and how it corrolates to my solar production and the grey in the battery chart is the cloud cover in %.
Attachments
Last edited:
Any tutorial on how to get this?While there isn’t much to look at in that interface there is a lot of API data available, so I use the API data for better graphs/reporting, you can also see in the battery graph by the vertical dotted red and green lines when it stopped received data during the upgrade to 21.31.0, in the graphs on the right side the top one also shows the solar altitude in percent and how it corrolates to my solar production and the grey in the battery chart is the cloud cover in %.
There are a couple pre-built solutions out there like GitHub - liveaverage/docker-powerwall-dashboard: Grafana dashboard showing trend & historical data polled from Tesla Powerwall 2 API served up in an easy to use docker image
However I went a little more manually and used the python module from here GitHub - jrester/tesla_powerwall: Python API for Tesla Powerwall and have some scripts to handle sending the data to influxdb
However I went a little more manually and used the python module from here GitHub - jrester/tesla_powerwall: Python API for Tesla Powerwall and have some scripts to handle sending the data to influxdb
Also bumped to 21.31.0. Other than the partial battery graphic, the way power moves around seems different. Previously, if the battery was at 100%, solar generation would show going to house and grid. Now, it seems even at 100%, power flows solar to house, grid, AND battery, with occasionally from battery flowing to house as well. This occurs when more solar is being constantly generated than house can use. It's almost the same thing that has always happened where, with plenty of solar being produced, the grid briefly flows in for the gateway to check that it's still live.
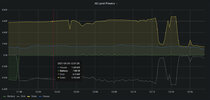
Seeing similar differences in battery power flow, in the attached graph you can see that I hit 100% battery at 11:58, and then it continued sending about 100W of power to the battery for a little while then started bouncing between sending and receiving power from the battery. Prior to 21.31.0 it would drop to 0W or maybe at most 20W trickle to the battery.Also bumped to 21.31.0. Other than the partial battery graphic, the way power moves around seems different. Previously, if the battery was at 100%, solar generation would show going to house and grid. Now, it seems even at 100%, power flows solar to house, grid, AND battery, with occasionally from battery flowing to house as well. This occurs when more solar is being constantly generated than house can use. It's almost the same thing that has always happened where, with plenty of solar being produced, the grid briefly flows in for the gateway to check that it's still live.
Attachments
wjgjr
Active Member
Yes, this is what I am seeing along with the behavior I described in my earlier post. As an example, yesterday I showed a flow of 0.9 kWh from PW and 1.9 kWh to PW. For the entire month of May (where I had only a very brief outage) I show 0.2 kWh from PW. So in one day, my PWs apparently exported more energy (with no outages) than in an entire month.Also bumped to 21.31.0. Other than the partial battery graphic, the way power moves around seems different. Previously, if the battery was at 100%, solar generation would show going to house and grid. Now, it seems even at 100%, power flows solar to house, grid, AND battery, with occasionally from battery flowing to house as well. This occurs when more solar is being constantly generated than house can use. It's almost the same thing that has always happened where, with plenty of solar being produced, the grid briefly flows in for the gateway to check that it's still live.
I don't know if there is some sort of battery management or other purpose behind the change, but this is a case where prompt, complete release notes would be helpful to understand the change in behavior.
Surely you jest.but this is a case where prompt, complete release notes would be helpful to understand the change in behavior.
Surely you jest.
August 2021
Tesla App Version 21.31.0
We changed some stuff but don't want to commit what we did to writing in case it doesn't work so management doesn't yell at us (again). Should be enough to say that we made a major improvement by hacking the battery size (same power, smaller graphic!) and made the random power scrolling dots randomly scroll some more without rhyme or reason. Any actual reflection of power flow is purely coincidental. Stay tuned for our next release, happening during your next grid outage.
OMG lmao.... im wiping coffee off my monitor from actually laughing out loud right now.....
eml2
Member
I am seeing the exact same thing with 21.31.0.Seeing similar differences in battery power flow, in the attached graph you can see that I hit 100% battery at 11:58, and then it continued sending about 100W of power to the battery for a little while then started bouncing between sending and receiving power from the battery. Prior to 21.31.0 it would drop to 0W or maybe at most 20W trickle to the battery.
Sorry, couldn't resist. Send me the bill for the monitor and I'll submit it to Tesla for payment.OMG lmao.... im wiping coffee off my monitor from actually laughing out loud right now.....
Similar threads
- Replies
- 1
- Views
- 453
- Replies
- 40
- Views
- 3K
- Replies
- 5
- Views
- 428
- Replies
- 0
- Views
- 250