- 3,5,7 rule sounds like a way to tier stop losses? 3%,5%,7%?
Generally speaking, just using % is not an ideal way to identify stop losses. Its much better to use some price analysis (in context of this thread, technical analysis, though folding in more fundamental and macro analysis is never a bad thing) to identify the price targets.
At least IMO, laddering (multiple stops/entries/exits) is a sign of uncertainty that leans on FOMO and HRH (hope real hard) more than, say, just reducing your position size (and thus reducing your downside risk). At the end of the day, If your analysis is wrong, its wrong, and its best to stop out when its wrong. If price reverses, your initial analysis was still wrong, so stopping out is still the right play. Back to the books then to understand if anything needs to be modified in your analysis, or whether the loss was just a statistical inevitability.
If you're going to ladder, at least combine it with technical analysis. Whatever method you decide to cap your risk (conservatively, 2% of your portfolio per position is a good place to start) you can build the ladder with ~equivalent loss.
- 4 position minimum (maximum 8) for a small account of $100,000 , I assume this means roughly 25% of portfolio on 4 different stocks?
It is never a good idea to quantify "rules" of one's technical analysis strategy in this manner. Technical analysis is all about finding the right entries and exits. Forcing a position on a bad entry and/or skipping a good entry just because its outside the rails will lead to sub-optimal trading returns. Besides, Its always good to have free capital in a trading account.
An investing account is a bit different, but that's not what we're talking about here.
- he mentioned a way of hedging by selling DITM calls… which seems interesting to me…. So if you think the stock is going down for a few weeks, selling DITM calls basically gets you paid if stock goes down. Not sure if folks that do that do so on a portion of their positions… but this sounds like a conscious decision to let go of a portion of their stocks.
Its not a great way to allocate capital IMO. The DITM will require quite a bit of scrilla to cover the margin requirement, and the high ∆ of the DITM (say, .9 or even higher) will move pretty close to equivalent shares (1.0) in both directions, so upside movement will majorly offset profit from the anchor leg of the position. Also the DITM will have pretty minimal extrinsic value, so it won't realize much CV movement from volatility...Volatility, of course, being a major reason one is trading options in the first place...
Better just to enter with a smaller position that has ~equivalent downside exposure/potential, which will inevitably result in ~similar upside to the big+hedged position. Then you can hold on to or otherwise allocate the 'freed up' capital.
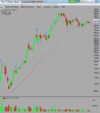
- follow the action around the 50 day moving average = guardrail with some subjectivity
Any indicator needs to be analyzed in a bigger picture. 50MA is a good one but it doesn't stand alone (no indicators stand alone), so the "subjectivity" is really "relative to other indicators". My brand of analysis uses just a couple indicators (primarily price-volume accumulation and distribution zones, trendlines, traditional support/resistance, and 50/200MA, but secondarily things like strength of preceding moves, volume trends, candle formations, pro gaps, and sometimes floor trader pivots) and looks for convergence of a couple of those indicators to inform my entry/exit/stop.
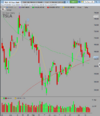
- “upside reversals” are major signals of support
Big upside reversals are
usually A Good Thing; as with everything, best to overlap with other indicators to improve their statistical probability, like a reversal on a MA or trendline, big volume, etc.
is the daily chart interval the chart of choice when he is talking about 50 day moving average?
Daily is the only timeframe where the traditional 50/200MA make any sense. (Other common daily MA lengths are 20, 10, and 5). For most other timeframes shorter lengths are usually more useful. For instance, a 50MA on a monthly TSLA chart is worthless...maybe a 52MA on weekly might be useful but probably less so with TSLA, etc. In the other direction, shorter timeframes (60, 5...for a while I was big on 130) don't really respond as well to long length MAs because inevitably the MA is pulling from previous days and the overnight gaps kind of muck it all up. Maybe if you're trading on a 1 or 2 min timeframe with a 50 or 100MA it works, but if that's where you are with trading you're
way beyond whatever us hacks on TMC are doing.

Anyway, identifying the right timeframe and MA length its really just iterating into something that works for what you're trying to do. That doesn't mean they're not as useful as 50/200 on daily, it just means they're not as self-fulfilling as 50/200 on daily. Like, if you're day trading on a 5 min candle, you might want to highlight MA crossovers with optimized lengths as potential entry points. Maybe the crossover of an 8 candle SMA and a 19 candle volume weighted MA is the bee's...or something... I've had genetic optimizers spit out some wacky things...