On the contrary, I have found this formula to always produce (for my AWD) 230Wh/rmi for the discharge constant, even as my full capacity has gone from 310 rated miles to ~305 rated miles. It is very, very accurate (I usually see within 0.3% or so for a valid test).
I have also measured it on a friend's car, who has 289 rated miles at 100% - and it also produces 230Wh/rmi.
I'm willing to accept that the constant COULD change, but we would need data to prove that, from a car with significant "degradation." So far - see the example here - the available data clearly suggest it does not change when capacity is reduced.
Take
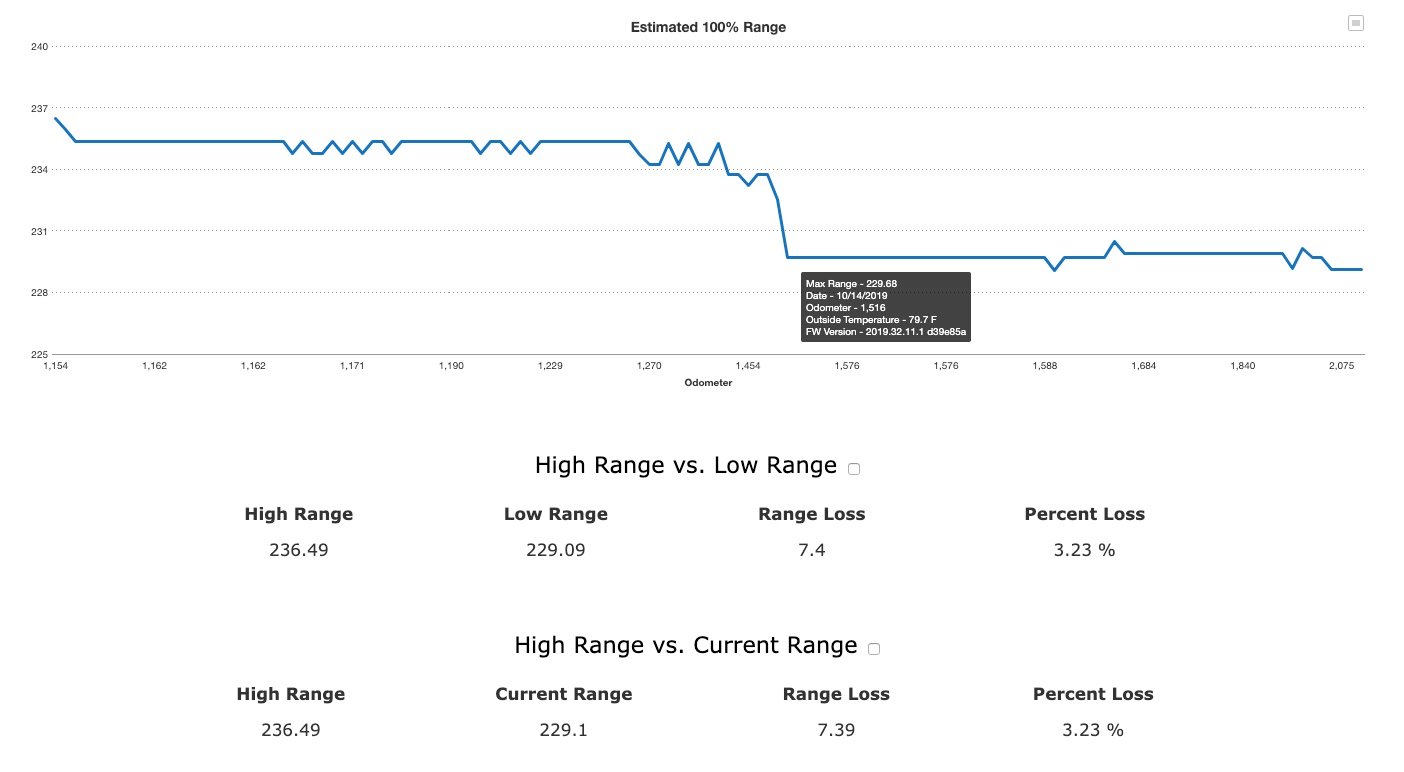
@earthwormjim for example. His full range is currently 226 rated miles (5.8% degradation from 240 rated miles). If the constant changed with loss of capacity ("degradation"), then we would expect a change in my 209Wh/rmi predicted value (to something like 200Wh/rmi???...not clear how you think it would change...). But this value has been verified by users who have 240 rated miles at 100% (see my post from Sunday to a new user) - and
@earthwormjim himself has verified it is STILL 209Wh/rmi in his car, with 226 rated miles.