You can install our site as a web app on your iOS device by utilizing the Add to Home Screen feature in Safari. Please see this thread for more details on this.
Note: This feature may not be available in some browsers.
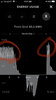
That is a chart of whether or not you are transferring power from or to the grid. You need to look at the graph for total energy usage if you want to see how your charge session went. That is probably the "home" icon.
Better to post this in the powerwall/solar section and other solar users can help you.
That's a graph of your total household grid demand/supply, right? I think the gist of your question is about the saw-tooth nature of the high demand periods. True? Are you certain that's attributable to your car? What about home heat cycling on and off overnight?
That's a graph of your total household grid demand/supply, right? I think the gist of your question is about the saw-tooth nature of the high demand periods. True? Are you certain that's attributable to your car? What about home heat cycling on and off overnight?


")