My above calculation assumed all of the panels are facing directly south, and that is the very best orientation to get peak power. BTW, for this time of year at 44 degree latitude, the optimal panel inclination would be around 66 degrees.
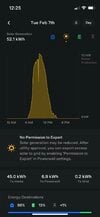
Normally, we describe north as azimuth 0 degrees, so 110 degrees is much more east than south, while 150 is still 30 degrees east of south. Using PVWatts, with your estimated roof angles and azimuths, with 5% system losses, 98% inverter efficiency, the results for the 8kW part is 6976W at a little after 10AM. The 2.8kW system reaches 2596W close to 11AM. So your peak is perhaps 9.6kW. Modeled for February 13th, with albedo = 0.87.
It's very unlikely that your reported power is accurate.
Yes, I also am describing north as azimuth 0 degrees, so we're on the same page in terms of the orientation of my panels. I know that facing directly south is the very best orientation to get peak power
over an entire day. But the sun is moving throughout the day, and if the solar panels could move and track the sun, that would be more ideal than being stationary at 180 degrees.
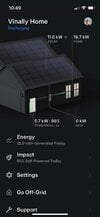
My point being that at a given time a day depending on the time of year, being at 110 degrees could generate more electricity than 180 degrees, but only for a sliver of the day, just like what happened to me. I obsessively look at my Tesla app and watch as the energy being produced by the panels goes up and down, depending on if its clear or a cloud comes in and blocks the sun. I see it rise and fall in real time as I'm looking out the window, and production rises and falls in a logical way. When the sun sets, production drops to 0 kW. So the monitoring isn't seeing any house load anytime the sun is down, as you would expect if monitoring was set up correctly.
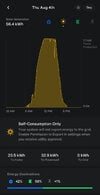
Respectfully, I don't think your theory has any evidence to back it up. I have my Tesla app reporting this. I also don't think its a coincidence that my production went up to almost exactly the same number as the rating of my solar panels (10.8 kW). This has happened multiple times too. And just yesterday I hit 8.5 kW. Remember, my inverter is rated at 7.6 kW. So anything beyond 7.6 kW is considered "impossible".
Considering Tesla has said to another person here that the Powerwall+ can produce more energy than the rating of the inverter, I think we all need to be open and consider that this may actually be the case.
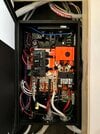
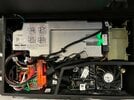
I hope others that have seen this activity with their Powerwall+ systems chime in. I attached photos of my inverter and Backup Gateway 2 wiring configurations so you guys can see if the CTs are in the wrong spot. If they are, then I take everything I said back!