Reciprocity
Active Member
Actually with SCO, I can buy options... hmm...Thanks VA for the idea.


You can install our site as a web app on your iOS device by utilizing the Add to Home Screen feature in Safari. Please see this thread for more details on this.
Note: This feature may not be available in some browsers.
Neighborhood Electric Vehicle. e.g.: (the one on the left)What's a NEV?
Yes, SCO. Thanks.
The end of natural gas is near
I've often thought that gas would only bridge to batteries. Apparently the major makers of gas turbines were rapidly scaling back production last year. We may be near the gas peaker peak. If production goes low enough then there wont be enough new capacity of gas generators to cover retired capacity. The challenge is that big batteries can now provide peak power at less cost, while integrating renewables and providing a deep stack of services. The real kicker is that while a 100MW gas plant takes about 6 years to develop, Tesla can deploy 100MW of battery power in about 100 days and wind or solar can be included within a year.
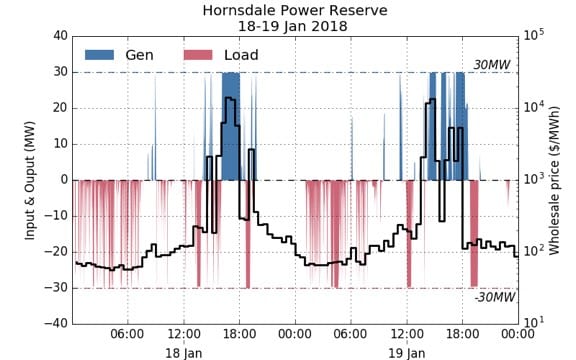
Here's an interesting chart from the Tesla battery in South Australia.
Tesla big battery moves from show-boating to money-making
This Tesla can go from 0 to 100MW in 140 milliseconds! Look at how delicate some of the trading is. These two days of rate arbitrage brought in about $1M. I doubt a gas peaker can be as nimble. With enough battery capacity on the scene, these peak prices could be pushed down even as the low early morning prices could be supported. The Hornsdale Power Reserve is supposed to be paired with a wind farm. I don't know if that farm was online at this time.
This rate arbitrage service is just using 30MW / 90MWh of capacity out of 100MW / 130MWh. That leaves the other 70MW /40MWh for other services in the stack.
Thanks for the clarification. I wonder if the volatility in charging, then, is due to the gustiness of the wind farm. Presumably, the battery could be trimming off excess of wind production so that the net wind power delivered to grid is really smooth and reliable. This would explain the streakiness of charging.As I understand it, the wind farm was previously built and already in service. That's what enabled the "Tesla Big Battery" to be built so quickly - the wind farm already existed and had a grid interconnect already in place that the Hornsdale Power Reserve could be connected to (no grid wiring needed).
Thanks for the clarification. I wonder if the volatility in charging, then, is due to the gustiness of the wind farm. Presumably, the battery could be trimming off excess of wind production so that the net wind power delivered to grid is really smooth and reliable. This would explain the streakiness of charging.
Thanks for the clarification. I wonder if the volatility in charging, then, is due to the gustiness of the wind farm. Presumably, the battery could be trimming off excess of wind production so that the net wind power delivered to grid is really smooth and reliable. This would explain the streakiness of charging.
That has to do with the stack of services it provided. They basically partition capacity (both power and energy) for different purposes. The state pays for the 100WM/30MWh portion for dealing with emergency power. The other 30MW/90MWh Neoen can use to trade power in the wholesale market to make a profit. I suspect that when emergency service requires it the 30MW portion for trading gets diverted to emergency use. So stacking is not exactly a fixed partition at all times.Another piece of the puzzle is that the Hornsdale Power Reserve, or at least that facility, is really more like 2 facilities in 1. I'll see if I can find an article that makes the specific sizes clear, but the idea is that part of the reserve is high power and low energy (~100MW and ~30 MWh) - that piece is contracted by the state government of SA and is used for grid services.
The other is low power (~30 MW) and high energy (~100 MWh), and is owned and operated by the wind farm owner (Neoen I think is the name), and is used to store excess wind production and smooth out peaks and valleys in the wind farm output to the grid.
That has to do with the stack of services it provided. They basically partition capacity (both power and energy) for different purposes. The state pays for the 100WM/30MWh portion for dealing with emergency power. The other 30MW/90MWh Neoen can use to trade power in the wholesale market to make a profit. I suspect that when emergency service requires it the 30MW portion for trading gets diverted to emergency use. So stacking is not exactly a fixed partition at all times.
So if you find a good article on the Hornsdale stack, let us know. I do think that stacking is one of the most important concepts for how batteries optimize value creation, and it is not entirely obvious how stacking works. Many arguments about whether batteries are cost effective run into the error of fixating on just one sort of service while ignoring the full stack potential. We've all seen those cost of storage calculations that make battery storage not look so attractive, but this ignores things like voltage regulation, frequency regulation, back up power, etc. which create multiple revenue streams that partly pay for the cost of storage, so that the net cost of storage may actually be quite affordable.
")
Ready for $100 oil?
I think that is entirely possible. But more because of a weak USD rather than because we have an actual (world) price movement. In fact, the price of WTI is pretty much unchanged (+1.3%) over the year of 2017 from a EUR perspective.
If you compare WTI to Sugar and take Euro as base currency you get that both commodities - while not being totally "static" have a pretty high correlation in their price movements and are - more importantly - within +/- 4% of the prices a year ago. So I don't think this is oil specific.
Crude Oil (petroleum); West Texas Intermediate vs Sugar - Price Rate of Change Comparison - IndexMundi
Unless I missed something fundamental here. Problem will be that much of the oil accounting is going on in USD so I think there will be a problem at some point in time if the USD tanks too much...
EDIT: I need to think about this more. I don't think what I wrote above is entirely accurate. Yes, the forecast for the USD is not brilliant, but I don't think we have had a horrible 2017 so I don't think what I wrote is the complete story. What would be a good way to compare crude prices against a basket of currencies?
Do you think the relationship could be the other way around?
I'm not sure I follow? The higher the oil price, the lower the USD?
Great vid, thanks for sharing!BNEF Talk: The Future of Electric Vehicles
I highly recommend watching this entire 16 minute video.
Collins finally gives attention to commercial EVs. He notes that in 2016 16GWh of batteries went into Chinese EV buses while 20.5GWh all global EV autos. By my own estimate I figure that the buses may be displacing about 3 times as much fuel per day as the autos. So tracking EVs in GWh is very important. GWh is what links more closely with demand on minerals and impact on oil markets and emissions.

World
                        3.60%            0.410
Year    EV    ICE    Total    EV Growth    ICE Growth    Total Growth    EV Share     Logit Share    Change Logit
2012    134    78,690    78,824                0.17%    -6.38
2013    211    84,189    84,400    57.5%    7.0%    7.1%    0.25%    -5.99    0.39
2014    325    85,201    85,526    54.0%    1.2%    1.3%    0.38%    -5.57    0.42
2015    546    87,519    88,065    68.0%    2.7%    3.0%    0.62%    -5.08    0.49
2016    774    89,226    90,000    41.8%    2.0%    2.2%    0.86%    -4.75    0.33
2017    1,218    93,938    95,156    57.4%    5.3%    5.7%    1.28%    -4.35    0.40
2018    1,900    95,536    97,436    56.0%    1.7%    3.6%    1.95%    -3.92    0.43
2019    2,936    98,004    100,940    54.5%    2.6%    3.6%    2.9%    -3.51    0.41
2020    4,515    100,055    104,570    53.8%    2.1%    3.6%    4.3%    -3.10    0.41
2021    6,894    101,436    108,330    52.7%    1.4%    3.6%    6.4%    -2.69    0.41
2022    10,422    101,804    112,226    51.2%    0.4%    3.6%    9.3%    -2.28    0.41
2023    15,533    100,729    116,262    49.0%    -1.1%    3.6%    13.4%    -1.87    0.41
2024    22,702    97,740    120,442    46.2%    -3.0%    3.6%    18.8%    -1.46    0.41
2025    32,339    92,435    124,774    42.4%    -5.4%    3.6%    25.9%    -1.05    0.41
2026    44,609    84,651    129,261    37.9%    -8.4%    3.6%    34.5%    -0.64    0.41
2027    59,256    74,653    133,909    32.8%    -11.8%    3.6%    44.3%    -0.23    0.41
2028    75,542    63,183    138,725    27.5%    -15.4%    3.6%    54.5%    0.18    0.41
2029    92,404    51,310    143,713    22.3%    -18.8%    3.6%    64.3%    0.59    0.41
2030    108,780    40,101    148,881    17.7%    -21.8%    3.6%    73.1%    1.00    0.41
2031    123,909    30,326    154,235    13.9%    -24.4%    3.6%    80.3%    1.41    0.41
2032    137,449    22,333    159,782    10.9%    -26.4%    3.6%    86.0%    1.82    0.41
2033    149,410    16,117    165,528    8.7%    -27.8%    3.6%    90.3%    2.23    0.41
2034    160,020    11,460    171,480    7.1%    -28.9%    3.6%    93.3%    2.64    0.41
2035    169,584    8,063    177,647    6.0%    -29.6%    3.6%    95.5%    3.05    0.41
2036    178,404    5,631    184,035    5.2%    -30.2%    3.6%    96.9%    3.46    0.41
2037    186,740    3,913    190,653    4.7%    -30.5%    3.6%    97.9%    3.87    0.41
2038    194,799    2,710    197,509    4.3%    -30.7%    3.6%    98.6%    4.27    0.41
2039    202,739    1,873    204,612    4.1%    -30.9%    3.6%    99.1%    4.68    0.41
2040    210,678    1,292    211,970    3.9%    -31.0%    3.6%    99.4%    5.09    0.41
USA
                                                        2.52%                                     0.309
Year    EV    ICE    Total    EV Growth    ICE Growth    Total Growth    EV Share     Logit Share    Change Logit
2012       55    14,419    14,474                             0.4%    -5.57
2013       97    15,548    15,645    76.4%    7.8%    8.1%    0.6%    -5.08    0.49
2014      120    16,318    16,438    23.7%    5.0%    5.1%    0.7%    -4.91    0.16
2015      115    17,309    17,424    -4.2%    6.1%    6.0%    0.7%    -5.01    -0.10
2016      157    17,287    17,444    36.5%    -0.1%    0.1%    0.9%    -4.70    0.31
2017      200    16,894    17,094    27.4%    -2.3%    -2.0%    1.2%    -4.44    0.27
2018      400    16,407    16,807   100.0%    -2.9%    -1.7%    2.4%    -3.71    0.72
2019      554    16,677    17,231    38.5%    1.6%    2.5%    3.2%    -3.40    0.31
2020      765    16,900    17,665    38.1%    1.3%    2.5%    4.3%    -3.10    0.31
2021    1,051    17,059    18,111    37.5%    0.9%    2.5%    5.8%    -2.79    0.31
2022    1,438    17,129    18,567    36.8%    0.4%    2.5%    7.7%    -2.48    0.31
2023    1,954    17,082    19,036    35.9%    -0.3%    2.5%    10.3%    -2.17    0.31
2024    2,631    16,885    19,516    34.7%    -1.2%    2.5%    13.5%    -1.86    0.31
2025    3,504    16,504    20,008    33.2%    -2.3%    2.5%    17.5%    -1.55    0.31
2026    4,601    15,911    20,513    31.3%    -3.6%    2.5%    22.4%    -1.24    0.31
2027    5,943    15,087    21,030    29.2%    -5.2%    2.5%    28.3%    -0.93    0.31
2028    7,530    14,031    21,560    26.7%    -7.0%    2.5%    34.9%    -0.62    0.31
2029    9,335    12,769    22,104    24.0%    -9.0%    2.5%    42.2%    -0.31    0.31
2030   11,308    11,354    22,662    21.1%    -11.1%    2.5%    49.9%    0.00    0.31
2031   13,375     9,858    23,233    18.3%    -13.2%    2.5%    57.6%    0.31    0.31
2032   15,457     8,363    23,819    15.6%    -15.2%    2.5%    64.9%    0.61    0.31
2033   17,478     6,942    24,420    13.1%    -17.0%    2.5%    71.6%    0.92    0.31
2034   19,384     5,651    25,036    10.9%    -18.6%    2.5%    77.4%    1.23    0.31
2035   21,143     4,525    25,667    9.1%    -19.9%    2.5%    82.4%    1.54    0.31
2036   22,742     3,573    26,314    7.6%    -21.0%    2.5%    86.4%    1.85    0.31
2037   24,189     2,789    26,978    6.4%    -21.9%    2.5%    89.7%    2.16    0.31
2038   25,500     2,159    27,659    5.4%    -22.6%    2.5%    92.2%    2.47    0.31
2039   26,697     1,659    28,356    4.7%    -23.1%    2.5%    94.1%    2.78    0.31
2040   27,803     1,268    29,071    4.1%    -23.6%    2.5%    95.6%    3.09    0.31