jhm,
I don't think one can do these sums using peak-to-trough or other simplifications, except in retrospect, i.e. one must do the detailed numbers first and only then can one back out plausible heuristics. And those heuristics might fail at another location's integrated grid (e.g. ERCOT vs UK). These analyses can be very "context-specific" to use the term I prefer.
In my experience one can either do time-domain analysis, or frequency-domain analysis. Personally I and my colleagues developed a time-domain tool and I am about to give you some screenshots from a UK model I ran in 2016 to forecast what might happen if in 2022 all coal and nuclear were taken off the UK grid and the amount of gas remained at the 2016 level. The point to appreciate is that the more the resource signature (wind or solar) is intrinsically aligned with the load signature, or can be tuned to align with the load signature by way of skewing system build out, then the less overbuilding is required. That overbuilding might be additional (battery or hydro) storage, additional transcontinental grid interconnects, additional wind & solar, or additional reserve fossil capability.
You simply cannot do these sums the way you are proposing, unless one runs the more complex models and backs out the right answer. Only then can you (as if by magic) show the simple sum. At least that is my opinion. That opinion is based on running many many thousands of simulated years, each of which is a 'true' scenario that faithfully represents a possible weather outcome in an area of interest (these are Markov models of wind & solar at 1h intervals, using data slices for monthly weather). The real issue and insight one obtains is how likely ( ... march of 9s) any given generation vs load system might get caught out and fail to deliver power on demand.
I have never run it but I believe you can do similar studies in HOMER. Personally we put our tool to bed in about 2015 and it will not be until I retire (maybe next year) that I resuscitate it. My understanding is that the main grid etc companies and energy ministries spray very large amounts of money at bespoke models that do similar things.
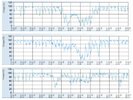
In the graphs below the variable that is being displayed is the State Of Charge of the aggregated UK national battery as calculated at 1h timersteps for a series of years. There are correspending graphs for windspeed, generation, load, cyclic life, economics, etc. There is a lot of conservatism baked into this set of runs because I assumed each hour of each day was at the upper end of the UK forecast 2022 load profiles, and various other factors.
Anyway I hope this helps illustrate the issues with some slightly more 'real' data.
View attachment 719225
View attachment 719227
Interestingly the comment I wrote to myself in my draft 2016 report was rather prescient, " The 5-years above are sequential, i.e. they are not selected. It continues to be that the real grid stressor is low resource availability periods in the Summer rather than the Winter."
I hope to return to studies of this nature, both at tool development and system analysis level, when I have more free time. It would be nice if the tSLA share price headed upwards so that I don't need to concern myself with earning a crust after this year
")
EDIT.
ps1. You can see how the model is correctly simulating typical frontal weather systems passing across the UK at 1-2 week intervals.
ps2. This was just blindly using the forecast demand which included some Ofgem/NationalGrid/DoE assumptions regarding EV and heat pump deployment - i.e. not much ! Clearly looking further ahead one takes more heat > grid shifting and liquuids > BEV into account. Which will almost certainly lead to a greater skew towards wind.
ps3. My draft conclusion at the time was "
Conclusion
With 36GW wind and 30GW solar allied with 30GW conventional (of which some is hydro & biomass) this
would be a deep penetration of renewables into the electricity mix, probably about 60% rather than the
envisaged 40% in the 2020s (must calc exact number) yet seems technically feasible and cost-comparable with
the nuclear option. Therefore in the 2020 period it is realistic to consider running the UK electrical system on a
non-nuclear basis with a deep renewables mix. By extension it appears that progressing beyond 60% to100%
renewables penetration in electricity generation is also possible. (Must do other things now !)
"