Welcome to Tesla Motors Club
Discuss Tesla's Model S, Model 3, Model X, Model Y, Cybertruck, Roadster and More.
Register

Some views on current price action

This site may earn commission on affiliate links.
Jesse,
Thanks for the cautionary note. I guess smart traders, like you, go an extra step further creating monthly candles to get a better idea of tradable patterns.

Now, I wonder, with the Wall Street being dog-eats-dog world, market manipulation could be in play to twist these monthly candle patterns in their favor. Is it possible to negate this possible manipulation by taking each monthly period from, say 15th of one month to 15th of next month? My assumption here is that any manipulation is short lived, few days, and gets unwound few days later. Thanks

Very good point. So the reason why I put more weight in higher time frames, weekly vs daily, monthly vs weekly, is exactly because the longer the timeframe the harder it is to manipulate, the more capital it takes to form price action, the more predictive value in that price action.

However, to your point, price was so close to the borderline at the end of this month, it was perhaps more prone to manipulation. In fact, the sole reason why the monthly ended up bearish vs neutral was because of the GS downgrade.

To further support what you are saying, there are indeed monthly charts that end around the 15th(option expiration), and they paint a much less dire picture:

dark.PNG


Above is the current OptX monthly chart. The two candles circled is called a dark cloud pattern which on its own is bearish. BUT:

dark2.PNG


The same dark cloud pattern occurred in 2013, right before this happened:

dark3.PNG


So I think you make a good point, and there is some supporting evidence. However, I cannot ignore the monthly candle, and until it gets negated I have to remain cautious.
 

Attachments

  • dark.PNG
    dark.PNG
    37.7 KB · Views: 50
Last edited:
Very good point. So the reason why I put more weight in higher time frames, weekly vs daily, monthly vs weekly, is exactly because the longer the timeframe the harder it is to manipulate, the more capital it takes to form price action, the more predictive value in that price action.

However, to your point, price was so close to the borderline at the end of this month, it was perhaps more prone to manipulation. In fact, the sole reason why the monthly ended up bearish vs neutral was because of the GS downgrade.

To further support what you are saying, there are indeed monthly charts that end around the 15th(option expiration), and they paint a much less dire picture:

View attachment 216798

This is the current OptX monthly chart. The two candles circled is called a dark cloud pattern which on its own is bearish. BUT:

View attachment 216800

The same dark cloud pattern occurred in 2013, right before this happened:

View attachment 216801

So I think you make a good point, and there is some supporting evidence. However, I cannot ignore the monthly candle, and until it gets negated I have to remain cautious.

Jesse,
When you say 'remain cautious' what are you doing right now with your TSLA holdings?
Protective puts?
Thanks
 
Last edited:
So whether the analog will play out or not is still very much up in the air, especially given today's monthly close. But IF it works out, this is the analogy I see:

After 3 years of sideways action, going back down every time we hit the top of the range(too much supply), finally there is enough buying support(demand) to hold price up while consolidating at the top of the range. Under these technical conditions(supply vs demand), a positive fundamental catalyst breaks the upper range resulting in a new trend higher.

So to your point, perhaps a surprise GAAP profit this quarter wouldn't be as big a catalyst as the Model S taking off in 2013, but then, I am not expecting a 5X share price move within 6 months either. The size of the catalyst would determine the size of the move.

Of course this is still predicated on two things. 1. Will we have a positive surprise this quarter? 2. Will price still be up here by then to reflect similar technical conditions in 2013?
I think ~$240 is a nice support as you pointed out. Though a little doubtful with that horizontal line going all 2016. First they were relatively close together but ~$240 never showed any significance since last summer. Part of the reason I think was the institutional selling following SCTY merger news. But based on Fib and MA, ~$240 does offer support as we are seeing these two trading days.

Regarding next ER, I'm much less confident than last week after looking at the current progress of AP2.0, re-reading the recent ER letter, and considering their guidance for H1 2017. It will most likely be mediocre like the one we just had in terms of short term progression. And I don't think it will offer any help to the upside.

I think we'll be seeing some price-discovery in the next few months until Model 3 coming out in 10s of ks this years looks inevitable. At the same time, we did drop sharply and with the current support, I don't think we'll see lower prices in the short term but can't see new reasons for the stock shooting up high immediately.
 
Regarding next ER, I'm much less confident than last week after looking at the current progress of AP2.0, re-reading the recent ER letter, and considering their guidance for H1 2017. It will most likely be mediocre like the one we just had in terms of short term progression. And I don't think it will offer any help to the upside.

I reread Q4 CC transcipt and this comment from Wheeler seems potentially bullish for Q1, thoughts?

Jason S. Wheeler - Tesla, Inc.


On the cash receive end, we see $1 billion in cash burn, but I don't think that's fully accurate. We had $522 million in CapEx, so we're investing at a very healthy rate ahead of what we need to do for Model 3. And then there were certainly some timing differences. We talked about in our deliveries press release, we had 2,750 cars that we missed delivering them by a couple of days. So, I think there's a little cross quarter timing going on there. And it's not indicative of what cash flow from operations is going to look like in the future.
 
Last edited:
I reread Q4 CC transcipt and this comment from Wheeler seems potentially bullish for Q1, thoughts?

Jason S. Wheeler - Tesla, Inc.


On the cash receive end, we see $1 billion in cash burn, but I don't think that's fully accurate. We had $522 million in CapEx, so we're investing at a very healthy rate ahead of what we need to do for Model 3. And then there were certainly some timing differences. We talked about in our deliveries press release, we had 2,750 cars that we missed delivering them by a couple of days. So, I think there's a little cross quarter timing going on there. And it's not indicative of what cash flow from operations is going to look like in the future.
They are not guiding higher deliveries even with this 2750 cars going into Q1 ER. So I don't think it is that bullish. It is understandable as Fremont is undergoing changes for Model 3 and could impact the production line. But bottom line is, if you look at OpEx in total, with SCTY its shaping up to be ~$800M a Q, compared to ~$550M before. That needs 34k Model S/X (50% more than their guidance) at 25% gross margin to break even. Without recognizing AP2.0 revenue, 25% GM is impossible to achieve, and AP2.0 is not on track. SCTY and TE gross profit generation is negligible in face of this scale of OpEx as the total revenue and gross margin are both one order of magnitude lower than the auto business, they contribute around 1% of the gross profit of the auto business.
 
@Fallenone Tesla's cash on hand increased $300 million to $3.4B exiting Q4, doesn't this indicate a stronger cash flow position as reflected by their ABL lines and other non recourse debt, which Elon has said the overwhelming majority of those reflect products in transit to known customers, which sort of smooths out the noise from things like missing 1,000's of deliveries by a few days? Could you elaborate on this?
 
@Fallenone Tesla's cash on hand increased $300 million to $3.4B exiting Q4, doesn't this indicate a stronger cash flow position as reflected by their ABL lines and other non recourse debt which sort of smooths out the noise from things like missing 1,000's of deliveries by a few days? Could you elaborate on this?
The bulk of the cash increase was due to SCTY bringing over the cash they still had in late 2016 (259M as of end of Q3 2016, burned some more before acquisition and brought in 214M to the TSLA Q4 2016). Net cash flow is still largely negative thanks to increased OpEx, missed delivery, and not being able to recognize EAD revenue. At the rate reported in the latest ER, the cash SCTY brought over would be gone in less than two quarters just by SCTY's part itself. I believe energy generation (SCTY) and storage (TE) will be crucial and profitable to the whole business in the long run. But in short term (I'm thinking at least a year from now), they are burdens to the balance sheet. Well, not much of burden for TE because it's too small.

As I mentioned several times before, the short term value of SCTY can be providing cash when needed. As of end of Q3 2016, they had $5.5B solar energy system (leased and to be leased). I don't know what portion of that pie is leased but considering SCTY was collecting 122M periodic billing in Q3 2016, and assuming the lease goes at least 10 years, that's 4.9B future revenue in total. This is an asset management can use and has been using - selling future revenue at bulk with a discount to get cash right now. In some sense, this can be the cap raise TSLA needs for Model 3. They can "raise" a few hundred millions here and there. This can be the real contribution from SCTY until they transit from the lease model to sale model. Of course, by doing this there's the possibility that SCTY part will be nothing but a drag of few B of debt (if solar roof and other panels don't sell at all). But if they can pull this off to make Model 3 production working out this year and ramp it really up in 2018, this long-term debt can be paid back fairly quickly
 
  • Like
  • Helpful
Reactions: neroden and tlo
At the rate reported in the latest ER, the cash SCTY brought over would be gone in less than two quarters just by SCTY's part itself. I believe energy generation (SCTY) and storage (TE) will be crucial and profitable to the whole business in the long run. But in short term (I'm thinking at least a year from now), they are burdens to the balance sheet. Well, not much of burden for TE because it's too small.

You don't seem to be taking into account the $150M in cost saving synergies for scty projected for 2017 or the increasing shift away from PPA leases in 2017. And then we have other variables like @neroden has talked about with new accounting rules that could make things look better as early as Q1.
 
You don't seem to be taking into account the $150M in cost saving synergies for scty projected for 2017 or the increasing shift away from PPA leases in 2017. And then we have other variables like @neroden has talked about with new accounting rules that could make things look better as early as Q1.
Umm, I'm not taking into account of that because it doesn't appear anyway in the income statement, balance sheet, or shareholder letter... I assume the numbers are already incorporating that (i.e., it could have been more OpEx if not for that "$150M cost saving synergies".
 
  • Like
Reactions: neroden and SBenson
Thx Jesse,

I think the near term catalyst is a Cap Raise. Won't be surprised if it happens within the next few weeks.

Conventional wisdom (based on past raises) is TSLA will likely rise afterwards due to its derisking effect on tesla's cash position

Thoughts?

Yes I talked about this a couple of posts up. If they don't do one by the close today, I think they will by next Thursday. Indices should get at least a 5% pullback at some point, so I'd like TSLA to squeeze it in before that happens.
 
Umm, I'm not taking into account of that because it doesn't appear anyway in the income statement, balance sheet, or shareholder letter... I assume the numbers are already incorporating that (i.e., it could have been more OpEx if not for that "$150M cost saving synergies".

The biggest cost for SCTY is sales. You won't see those synergies recognized until every Tesla store starts selling solar sometime this summer. That will further cut down SCTY's sales staff and hopefully eliminate their most expensive leads(door to door sales).
 
@jesselivenomore, any concern with buying at this point? If it's over $260 tomorrow, which I feel is 95% chance, I feel it's all clear, but I'm not a trader, just a middling amateur.
Same question here: 2017 Investor Roundtable: TSLA Market Action, I know it will be hard to get your attention with your one-year(?) old around :)

I'd like to see where we close out the week today first before commenting. I suspect that we were held back a bit yesterday so that the secondary didn't get priced too high and screw over the banks' clients. Without interference now, I'd like to see how we hold up.

But early indication is that the monthly fractal/bearish reversal could get negated, especially if we close the month above 258. Then this is back on:


A lot of interesting things are happening with price action right now.

First lets look at short term ER reaction. Going into the report price was sitting right below resistance after forming a reversal candle the week before(not to mention rallying 100 points). So in order for us to break through this resistance a spectacular ER was required. What we got a was a mix of rosy Model 3 projections, scary short term financials(-$400M operating cashflow), CFO resigning, and confirmation of cap raise. Looking forward perhaps Model 3 development is most important, but what we got in front of us was a mix bag. Without a knockout ER, the path of least resistance was to the downside, especially given the reversal the week before. Also anticipation of the cap raise contributed greatly to the pressure on share price - Tesla does not get to decide at what price to raise capital, the market must find an equilibrium to accept the new shares first. This is why it is interesting to look at how SP reacted the past two cap raises.

View attachment 216340 View attachment 216341

The circled candle is the day after ER where a cap raise was implied, and the arrow points to the day capital was actually raised(at that day's closing price). The price action has been very consistent the last two times(August 2015, May 2016). The reaction to ER was pressured as price was seeking a level amenable to the cap raise, as price stabilized the following week, cap was raised within the price range established in the first day ER reaction. Once the cap raise was over with, price was allowed to appreciate. Actually there were some circumstances that led to price crashing back down afterwards(first time due to overall market China panic, second time due to SCTY acquisition), but I think those were coincidences. So if we follow a similar path this time, we should stabilize next week, raise cap above Thursday's close of 256, then price is allowed to head back up(at least temporarily). Keep in mind what that would look like on our current chart, because it gets really interesting.

So that's ER price action. Let's go back to the monthly analog that I posted a few weeks ago that I am working off of.


So I mentioned that even in 2013 on the way to the final breakout there can be pullbacks like Feb 2013. Someone asked what were the circumstances of that pullback, and as it turns out it was an earnings report, too. First lets look at the monthly chart which my analog is based on:

View attachment 216343

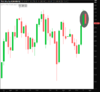
Now lets zoom in to the circled pullback, this time on the daily timeframe:

View attachment 216344

This is the daily view of that pullback before the final breakout. Circled is the ER that caused the pullback. Price stabilized in the following days after ER, and rallied back higher(before some more chop). Now remember what I told you to keep in mind of, what price action would look like right now if we followed the prior two cap raises. Would that not lead to a repeat of the price action in 2013? Also remember what caused the final breakout in 2013, a surprise profit. Are there any circumstances now(like deferred revenue of 2700 cars and AP 2.0) that would lead to similar reaction?

We will see how this all plays out. Remember that an analog is not telling you the future, just how price MAY react under similar circumstances. For me personally, I am not taking action(take off protection/add leverage) until we break above the local high we just made at 287, which would confirm the analog.

Besides the monthly reversal(potentially a fakeout caused by GS downgrade at the end of the month), the above scenario is actually playing out to a T so far. Also ignore that last line. There were some shortterm signals that caused me to take off protection so currently I am unhedged, but still have a couple bullets left for when/if we break 287. I wanted to update those short term signals over the weekend last week, but didn't have the time. Will do an update this week to go over them. Right now I'd suggest playing off the ichimoku cloud for shortterm price action.(I believe you are familiar with it)
 
Last edited:
JP Morgan's Marko Kolanovic has been making stellar market calls & today he touched on volatility that was recently discussed, posting here so it doesn't get lost in the other investor threads.
Marko is suggesting todays selloff was 1/2 political & the other "market internal pressures".

The man who moves the markets says to buy the Trump slump

I mean that was just one day so far. Eventually we will get a real slump like 10% correction, and that will be the easiest buy. Some people are looking for a "crash" like 2008 or 2000, I just don't see it. Not for at least another few years.
 
  • Like
Reactions: TMSE and kenliles
As for TSLA, I was going to do some shortterm technical analysis, but really there is no point. We are only a week away from the monthly close, and another day after that will be the delivery numbers. So really no sense in speculating when you will get your answers soon. Staying above 240 is mandatory. Closing the month above 254(where it opened) would be nice. Getting above 265(gap resistance) would be great. Good close to the week but back at resistance.
 
I mean that was just one day so far. Eventually we will get a real slump like 10% correction, and that will be the easiest buy. Some people are looking for a "crash" like 2008 or 2000, I just don't see it. Not for at least another few years.
I agree with this on a macro scale. As a long outlook investor, there are a number of signs to expect correction- but underneath that, too much strength to translate into major recessionary or other than 10-15% recalcitration.

It's all an educated guess of course, based on historic and other trends, subject to EXTREME conditions in political and global risks that have no historic basis. But with all considerations, currently I see these as greatly increasing the risk of pullbacks or corrections, but not yet more than that. 2c from over here...
 
  • Informative
Reactions: MitchJi
I'd like to see where we close out the week today first before commenting. I suspect that we were held back a bit yesterday so that the secondary didn't get priced too high and screw over the banks' clients. Without interference now, I'd like to see how we hold up.
...
Right now I'd suggest playing off the ichimoku cloud for shortterm price action.(I believe you are familiar with it

So, I ended up playing expected bounce of Ichimoku cloud (Mar 21-22), and it worked great, though I almost regretted it; it seemed for a while like a bounce wasn't gonna happen...
My buys averaged $256, to increase position from 102% to around 140% (jan 19, strike $100 calls, less than $1 time-value)

Considering all time high monthly close, @jesselivenomore, I am assuming you're very bullish again?
I hope and expect new ATH soon, and I'll consider investing all my leftover cash if we go over $292 with conviction. Drop under $270 (maybe $265?) would make me consider deleveraging back to 100%. Drop under $250 and I probably go to 50%

tsla bounce.JPG
Chaikin osc. going under 0 would also probably make me deleverage to 100%.
But really I'm expecting jump on Monday, unless deliveries really, truly, disappoint
 

Attachments

  • tsla bounce.JPG
    tsla bounce.JPG
    28.2 KB · Views: 82
  • Informative
Reactions: GoTslaGo