Welcome to Tesla Motors Club
Discuss Tesla's Model S, Model 3, Model X, Model Y, Cybertruck, Roadster and More.
Register

TSLA Market Action: 2018 Investor Roundtable

This site may earn commission on affiliate links.
Status
Not open for further replies.
I don't see why in this day an age the conversation must be at a 3rd grade level. With all this student loan debt, one would assume most people would have taken probability/statistics and should be able to meaningfully understand distributions.

Recall that the student loan debt crisis started going with late GenX and got bigger with Millenials and post-Millenials.... so you don't expect the average Baby Boomers or older person to be able to meaningfully understand probability, do you? ;)
 
Anyone want to unpack the WSJ and now other articles denouncing the Q3 ZEV credits on the 10-Q?

The WSJ is a dishonest newspaper which has been publishing politically motivated lying hit pieces for most of my life. They used to keep them on the editorial page, but since Rupert Murdoch, bought it, they have put them on the news pages too.

What's to unpack? We know that Rupert Murdoch backs fossil fuel interests with dishonest reporting. I have no idea why, but he does it consistently, in news media which he owns *worldwide*; it's quite dramatic in Australia, and the Murdoch owned newspaper "The Australian".
 
no counter argument here, but if the tax cuts at the corporate level helped so little, why are federal corporate tax receipts DOWN 20% this year.

because the mechanism whereby large corporations can reduce their tax burden to essentially nothing while small/midsize businesses cant still exists.

Personally, if it were up to me, I'd get rid of business taxes, capital gains taxes, and income taxes entirely, and go to a more progressive version of the "fair tax". I'd also replace most welfare-type programs with a basic income of about $8-10k per year.

So it'd look something like this: Basic income of $10k/year, consumption tax of ~25%, and consumption tax on luxury items of ~35%/year, and a carbon tax that would ramp up over a decade. Corporate and capital gains taxes reduced to nothing to spur investment growth and savings. The guy who only spends $20k a year would pay a net -$5k in taxes, the guy who spends $40k a year ~$0, and someone who spends $1,000,000 a year on a mix of regular and luxury items would pay ~$300k/year in taxes. Numbers would need to be adjusted, but you get the idea.
 
Capture-2018-11-07-10-49-11.png

Natural trading or paintjob?
 
  • Informative
Reactions: capster
Also note that it's even worse than that: a lot of the true annual income of very high net worth individuals in the top 0.01% like Mitt Romney is not categorized as 'income' and is not taxed with any income tax, at all. Their declared "income" is just a residual flow their tax advisor couldn't find a legal way to put into various corporate, off-shore or other tax-exempt holdings ...

The Silicon Valley computer programmer on the other hand will have a large chunk of their annual income declared and taxed as income.
Romney is peanuts, go after Buffett , Page, Bezos
 
BTW., for those who'd like to take a look at short sales transaction level data as well (shout-out to @Papafox, @neroden, @KarenRei, @ZachShahan and @ggr), it's publicly available in an obscure location on FINRA's website.

The ones for June, July, August and September can be downloaded from the following links:

(October data is not available yet.)

Warning: these are very large ZIP files, hundreds of MB compressed, ~3 gigabytes uncompressed.

The structure of the short-sales transaction logs is straightforward:
  • it's text files with a fixed record format of one transaction per line:
  • "Q|TSLA|20180831|15:58:10|S|100|301.850000||"
  • 'Q' is NASDAQ, then comes the ticker, date, timestamp, short-sale marker 'S', shares sold and finally execution price.
  • the files include all NASDAQ short sales - so filter for TSLA first. The data becomes a lot more manageable once filtered out for Tesla transactions only.
  • the data is always time-delayed by several weeks - the SEC and FINRA wouldn't want to create a disadvantage for short seller 'investors' by disclosing the patterns of their trades in an overly timely fashion, right? In a world of nanosecond level trading the short-seller transaction log itself becomes public only with weeks of delay. For example it's November 7 already, yet the October data won't be available for weeks.
  • Note the scope of the 'short sales' transaction log: these are only short sales, i.e. TSLA stock sold by traders who had a short position at the time of the trade. They do not include sales by traders long in TSLA.
  • Entries with the 'E' tag can probably be ignored: these are rare transactions by 'exempt' parties such as market-makers who technically are short TSLA in terms of inventory but are not actively trying to profit from shorting Tesla - they make up a fraction of the volume and are not significant factors in determining TSLA price action.
Anyway, even with these restrictions the transaction level short-sales data is very interesting and confirms @Papafox's empirical observations that 'icicles' of sudden downwards $TSLA price movements are created by short-sellers executing 'dumb' sale orders sometimes trading more than 10k shares in a single transaction with significant 'slippage' and immediate trading loss that no true investor in Tesla would utilize when selling shares.

The short-seller transaction data is evidence that many of these $TSLA price action anomalies are not primarily caused by stops or by HFT algos, they are not primarily caused by clever large investors trying to create additional liquidity during their periods of accumulation - but are caused by bog standard short-sellers with a short position in TSLA...

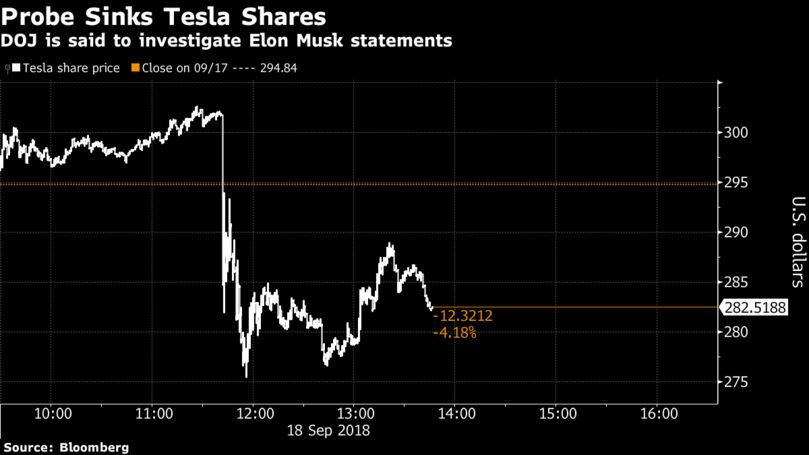
More data mining: in particular I took a look at the short sales transactions surrounding the infamous 'September 18 Bloomberg' article that caused a big ~10% drop in the $TSLA price from $300 levels to $270 levels.

I based this on the September transaction data available at:


The Bloomberg news article apparently broke on 11:42:27 and caused a -$13 drop within 10 seconds of heavy trading.

But the 60 minutes leading up to this event show suspicious patterns of trading that might be evidence of insider trading - short sellers shorting TSLA in the knowledge that a very negative and deceptively worded and headlined article would be released about Tesla. For example these two larger blocks of sales just 5 minutes before the news was released:

Code:
Q|TSLA|20180918|11:37:28|S|2000|301.939900||
Q|TSLA|20180918|11:37:57|S|3000|301.844300||

These were perfectly timed sales of uncharacteristically big blocks of shares, seemingly unconcerned about the execution inefficiencies such large sales suffer from. These sales were perfectly timed to benefit from the near daily high price levels, just minutes before the Bloomberg article was released.

The SEC could use their considerable investigative powers to uncover the identity behind those particular trades.

Here's the misleading Bloomberg article that triggered the sell-off:


Here's the effect on the price:
809x-1.png


That mystery mini-drop from the daily high of around $302, at around 11:30, and large block sales just minutes before the Bloomberg article was released?

If you look at the short-sales transaction log of only large block sales, then a pattern emerges:

Code:
Q|TSLA|20180918|10:00:46|S|2661|296.950000||
Q|TSLA|20180918|10:00:56|S|2700|296.855000||
Q|TSLA|20180918|10:01:21|S|2000|296.680000||
Q|TSLA|20180918|10:14:11|S|3000|299.459900||
Q|TSLA|20180918|10:17:50|S|3000|298.690000||
Q|TSLA|20180918|10:26:18|S|1800|298.865000||
Q|TSLA|20180918|10:32:03|S|2300|298.159900||
Q|TSLA|20180918|11:00:41|S|2000|299.685100||
Q|TSLA|20180918|11:03:59|S|1900|299.835500||
Q|TSLA|20180918|11:11:07|S|2700|301.072800||
Q|TSLA|20180918|11:13:11|S|2868|301.039300||
Q|TSLA|20180918|11:13:52|S|2100|301.070800||
Q|TSLA|20180918|11:15:37|S|2500|300.540000||
Q|TSLA|20180918|11:16:27|S|2400|299.898200||
Q|TSLA|20180918|11:21:20|S|2600|300.700600||
Q|TSLA|20180918|11:22:28|S|2167|300.634300||
Q|TSLA|20180918|11:23:48|S|3000|301.386100||
Q|TSLA|20180918|11:26:51|S|3000|301.900000||
Q|TSLA|20180918|11:37:28|S|2000|301.939900||
Q|TSLA|20180918|11:37:57|S|3000|301.844300||
Q|TSLA|20180918|11:39:17|S|1830|301.932400||

In this 120 minutes window more than 50% of large short sale transactions were executed in the 30 minutes preceding the Bloomberg news article.

Interesting coincidence.
 
Question on how NASDQ gets/updates their institutional shareholders list:
Tesla, Inc. (TSLA) Institutional Ownership & Holdings
I was looking at this list and most rows were from June 30th, only a few were from Sept 30th.

Anyone know how often NASDQ will get updates and when we could expect a whole picture of Sept 30th?
Seems my question the other day got buried quickly in tax/housing discussions, please pardon me to ask again.
Anyone has an answer?
 
  • Informative
Reactions: pdwitt
It's a nice round number with both psychological and actual significance. Yes, the ATH is 390 but not that many short/long positions were opened in the 350-390 range, the stock was only trading in that range for a short period of time and the total accumulated (cumulative) volume in that range wasn't all that high. Also, one could suspect that an even higher than normal fraction of trades near ATH were very short term positions (day trading, scalpers) that haven't been held.

Once again I find myself in exclusive company, having bought TSLA at 384.43$. :)

Luckily, those shares (that I still hold) consist of just about 1% of my TSLA stock, which is now decidedly green.

In fact, next time my TSLA stock brings me underwater, I expect it to be in this fashion.
 
Elon Musk on Twitter
If I am shorting TSLA I would be really scared these days.
Apparently, it only took Elon to just disappear from Twitter for a few days then come back and tweet some *sugar* that no one understands, and is completely not related to TSLA to move the stock up.
These are Isaac Asimov references, FYI
 
Once again I find myself in exclusive company, having bought TSLA at 384.43$. :)

Luckily, those shares (that I still hold) consist of just about 1% of my TSLA stock, which is now decidedly green.

In fact, next time my TSLA stock brings me underwater, I expect it to be in this fashion.
You must have been sweating. I know I was a bit. My original buy-in was sold 2 years ago at 280. Bought back in at 330, only to see it head towards 250. Thankfully I kept doubling down and brought my average to 280.
 
BTW., for those who'd like to take a look at short sales transaction level data as well (shout-out to @Papafox, @neroden, @KarenRei, @ZachShahan and @ggr), it's publicly available in an obscure location on FINRA's website.

The ones for June, July, August and September can be downloaded from the following links:

(October data is not available yet.)

Warning: these are very large ZIP files, hundreds of MB compressed, ~3 gigabytes uncompressed.

The structure of the short-sales transaction logs is straightforward:
  • it's text files with a fixed record format of one transaction per line:
  • "Q|TSLA|20180831|15:58:10|S|100|301.850000||"
  • 'Q' is NASDAQ, then comes the ticker, date, timestamp, short-sale marker 'S', shares sold and finally execution price.
  • the files include all NASDAQ short sales - so filter for TSLA first. The data becomes a lot more manageable once filtered out for Tesla transactions only.
  • the data is always time-delayed by several weeks - the SEC and FINRA wouldn't want to create a disadvantage for short seller 'investors' by disclosing the patterns of their trades in an overly timely fashion, right? In a world of nanosecond level trading the short-seller transaction log itself becomes public only with weeks of delay. For example it's November 7 already, yet the October data won't be available for weeks.
  • Note the scope of the 'short sales' transaction log: these are only short sales, i.e. TSLA stock sold by traders who had a short position at the time of the trade. They do not include sales by traders long in TSLA.
  • Entries with the 'E' tag can probably be ignored: these are rare transactions by 'exempt' parties such as market-makers who technically are short TSLA in terms of inventory but are not actively trying to profit from shorting Tesla - they make up a fraction of the volume and are not significant factors in determining TSLA price action.
Anyway, even with these restrictions the transaction level short-sales data is very interesting and confirms @Papafox's empirical observations that 'icicles' of sudden downwards $TSLA price movements are created by short-sellers executing 'dumb' sale orders sometimes trading more than 10k shares in a single transaction with significant 'slippage' and immediate trading loss that no true investor in Tesla would utilize when selling shares.

The short-seller transaction data is evidence that many of these $TSLA price action anomalies are not primarily caused by stops or by HFT algos, they are not primarily caused by clever large investors trying to create additional liquidity during their periods of accumulation - but are caused by bog standard short-sellers with a short position in TSLA...


With apologies in advance to anyone who might consider me a smarta$$ now, I will point out that at work and elsewhere I am the go-to person for extracting specific information from files such as these.

So if someone has a wish for extracting some particular and maybe non-trivial subset of information from these files, then feel free to ask me.
 
The US has relatively low tax rates on capital gains and so in some really extreme cases that can result in extremely wealthy individuals paying taxes at very low rates, but that is not typical. The top .1% of the US population pays a higher effective tax rate than the 1%, which in turns pays a higher rate than any other income bracket (save the top .1% obviously) .

I flat out don't believe that because it contradicts multiple other sources I've seen. I suspect falsified data.
 
Status
Not open for further replies.