as i am studying the non-gaap/gaap eps issue: although gross margins get non-gaap'd with stock-based comp and zev revenue taken out, the bottom line eps is non-gaap'd a different way.
for bottom line eps the methodology has shifted over the last 5-6 quarters, but the recent approach is start with net income take out stock based comp. and one-time gains/expenses (like those related to solarcity acquisition). i would lean towards taking out the solarcity fine in non-gaap numbers this time around.
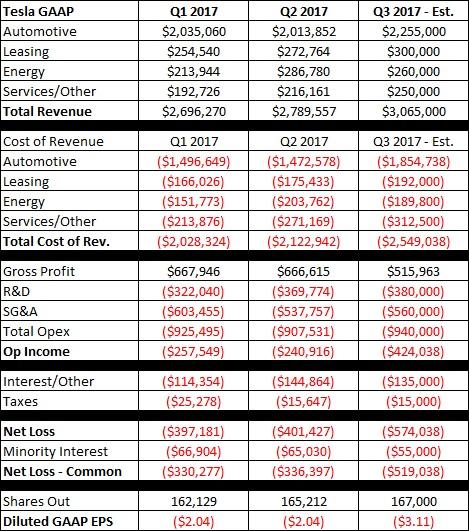
1. added non-gaap reconciliation section, see below -2.19 for non-gaap eps and -3.09 for gaap eps. that will be the worst in the last 7 quarters, at least.
2. i was mistakenly assuming some model 3's were leased, i believe they are all sales with no leases for now. this has the effect of bringing up model 3 revenue and gross margin. model 3 asp i adjusted slightly higher realizing i forgot to include options like autopilot and paint etc. model 3 gross margin i set to maintain total auto gross margin at 20% while assuming s/x gross margin of 25%.
3. speaking of s/x gross margin, that was guided lower in the last letter. but i think with higher production comes greater efficiency and so am favoring a slight uptick there taking midpoint of q3 2016 and q1 2017 gross margin (when production was around 25k units s/x).
4. i had the wrong share count, they had 167m shares going into the quarter and this reduces the loss per share.
5. i thought about r&d a bit after some comments and decided it was prudent to adjust it higher - for example they had to pay grohmann employees more. note that i try to estimate a split of tesla/scty r&d so those looking for full company r&d / sg&a should add those respective line items.
6. there's some downside risk from higher opex. they guided "essentially flat", but that could mean up 3%, which makes a meaningful difference to the bottom line number.
| … |
| ls veh % total |
| avg price s+x |
| avg price model 3 |
| revenue |
| auto sales ex 3 |
| auto sales mod 3 |
| auto leasing |
| 1 time autopilot |
| zev credits |
| total auto |
|
| energy storage |
| solarcity |
| grohmann |
| services/other |
| total revenue |
|
| cost of revenue |
| auto sales ex 3 |
| auto sales mod 3 |
| auto leasing |
| total auto |
|
| energy storage |
| solarcity |
| grohmann |
| services & other |
| total cost of rev |
|
| gross profit |
|
| auto gaap ex 3 gm |
| auto-zev ex 3 gm |
| model 3 gm |
| auto-zev incl 3 gm |
| storage gm |
| scty gm |
| grohmann gm |
| services gm |
|
| opex |
| tesla r&d |
| tesla sg&a |
| 1time acq cost |
| solarcity r&d |
| solarcity sg&a |
| total opex |
|
| op income |
|
| interest inc |
| interest exp |
| scty interest |
| other income exp |
| 1time scty gain |
| pretax income |
| income tax |
| net income |
| non-cont int. |
| net inc to common |
|
| basic shares |
| diluted shares |
|
| diluted gaap eps |
| gaap net income |
| - stock based comp |
| - one time scty |
| non-gaap net income |
| non-gaap diluted eps |
[TD2]
luv q3-17
[/TD2][TD2]
Jun-17
[/TD2][TD2]
Mar-17
[/TD2][TD2]
Sep-16
[/TD2]
[TD2]
0.21
[/TD2][TD2]
0.19
[/TD2][TD2]
0.26
[/TD2][TD2]
0.32
[/TD2]
[TD2]
108.00
[/TD2][TD2]
107.27
[/TD2][TD2]
108.06
[/TD2][TD2]
105.40
[/TD2]
[TD2]
53.00
[/TD2][TD2]
0.00
[/TD2][TD2]
0.00
[/TD2][TD2]
0.00
[/TD2]
[TD2]2,212,348[/TD2][TD2]1,913,852[/TD2][TD2]2,000,060[/TD2][TD2]1,778,901[/TD2]
[TD2]11,660[/TD2][TD2]0[/TD2][TD2]0[/TD2][TD2]0[/TD2]
[TD2]253,395[/TD2][TD2]272,764[/TD2][TD2]254,540[/TD2][TD2]231,285[/TD2]
[TD2]0[/TD2][TD2]0[/TD2][TD2]35,000[/TD2][TD2]0[/TD2]
[TD2]0[/TD2][TD2]100,000[/TD2][TD2]0[/TD2][TD2]138,541[/TD2]
[TD2]
2,477,403
[/TD2][TD2]
2,286,616
[/TD2][TD2]
2,289,600
[/TD2][TD2]
2,148,727
[/TD2]
[TD2]35,000[/TD2][TD2]15,680[/TD2][TD2]5,244[/TD2][TD2]23,334[/TD2]
[TD2]285,000[/TD2][TD2]271,100[/TD2][TD2]208,700[/TD2][TD2]0[/TD2]
[TD2]5,100[/TD2][TD2]10,200[/TD2][TD2]22,400[/TD2][TD2]0[/TD2]
[TD2]230,000[/TD2][TD2]205,961[/TD2][TD2]170,326[/TD2][TD2]126,375[/TD2]
[TD2]
3,032,503
[/TD2][TD2]
2,789,557
[/TD2][TD2]
2,696,270
[/TD2][TD2]
2,298,436
[/TD2]
[TD2]1,686,317[/TD2][TD2]1,472,578[/TD2][TD2]1,496,649[/TD2][TD2]1,355,102[/TD2]
[TD2]132,924[/TD2][TD2]0[/TD2][TD2]0[/TD2][TD2]0[/TD2]
[TD2]162,990[/TD2][TD2]175,433[/TD2][TD2]166,026[/TD2][TD2]161,959[/TD2]
[TD2]
1,982,231
[/TD2][TD2]
1,648,011
[/TD2][TD2]
1,662,675
[/TD2][TD2]
1,517,061
[/TD2]
[TD2]36,750[/TD2][TD2]19,414[/TD2][TD2]6,473[/TD2][TD2]24,281[/TD2]
[TD2]199,500[/TD2][TD2]184,348[/TD2][TD2]145,300[/TD2][TD2]0[/TD2]
[TD2]3,825[/TD2][TD2]7,600[/TD2][TD2]14,900[/TD2][TD2]0[/TD2]
[TD2]287,500[/TD2][TD2]263,569[/TD2][TD2]198,976[/TD2][TD2]120,359[/TD2]
[TD2]
2,509,806
[/TD2][TD2]
2,122,942
[/TD2][TD2]
2,028,324
[/TD2][TD2]
1,661,701
[/TD2]
[TD2]
522,697
[/TD2][TD2]
666,615
[/TD2][TD2]
667,946
[/TD2][TD2]
636,735
[/TD2]
[TD2]25.0%[/TD2][TD2]27.9%[/TD2][TD2]27.4%[/TD2][TD2]29.4%[/TD2]
[TD2]25.0%[/TD2][TD2]24.6%[/TD2][TD2]26.3%[/TD2][TD2]24.5%[/TD2]
[TD2]-1040.0%[/TD2][TD2]0.0%[/TD2][TD2]0.0%[/TD2][TD2]0.0%[/TD2]
[TD2]20.0%[/TD2][TD2]0.0%[/TD2][TD2]0.0%[/TD2][TD2]0.0%[/TD2]
[TD2]-5.0%[/TD2][TD2]-23.8%[/TD2][TD2]-23.4%[/TD2][TD2]-4.1%[/TD2]
[TD2]30.0%[/TD2][TD2]32.0%[/TD2][TD2]30.4%[/TD2][TD2]0.0%[/TD2]
[TD2]25.0%[/TD2][TD2]25.5%[/TD2][TD2]33.5%[/TD2][TD2]0.0%[/TD2]
[TD2]-25.0%[/TD2][TD2]-28.0%[/TD2][TD2]-16.8%[/TD2][TD2]4.8%[/TD2]
[TD2]270,000[/TD2][TD2]324,774[/TD2][TD2]239,070[/TD2][TD2]214,302[/TD2]
[TD2]470,000[/TD2][TD2]407,757[/TD2][TD2]446,637[/TD2][TD2]336,811[/TD2]
[TD2]0[/TD2][TD2]0[/TD2][TD2]67,000[/TD2][TD2]0[/TD2]
[TD2]30,000[/TD2][TD2]45,000[/TD2][TD2]44,800[/TD2][TD2]0[/TD2]
[TD2]145,000[/TD2][TD2]130,000[/TD2][TD2]127,988[/TD2][TD2]0[/TD2]
[TD2]
915,000
[/TD2][TD2]
907,531
[/TD2][TD2]
925,495
[/TD2][TD2]
551,113
[/TD2]
[TD2]
-392,303
[/TD2][TD2]
-240,916
[/TD2][TD2]
-257,549
[/TD2][TD2]
85,622
[/TD2]
[TD2]6,000[/TD2][TD2]4,785[/TD2][TD2]3,090[/TD2][TD2]2,858[/TD2]
[TD2]-65,000[/TD2][TD2]-54,441[/TD2][TD2]-46,146[/TD2][TD2]-46,713[/TD2]
[TD2]-54,000[/TD2][TD2]-54,000[/TD2][TD2]-53,200[/TD2][TD2]0[/TD2]
[TD2]-12,000[/TD2][TD2]-41,208[/TD2][TD2]-18,098[/TD2][TD2]-11,756[/TD2]
[TD2]-29,500[/TD2][TD2]0[/TD2][TD2]0[/TD2][TD2]0[/TD2]
[TD2]
-546,803
[/TD2][TD2]
-385,780
[/TD2][TD2]
-371,903
[/TD2][TD2]
30,011
[/TD2]
[TD2]20,000[/TD2][TD2]15,647[/TD2][TD2]25,278[/TD2][TD2]8,133[/TD2]
[TD2]
-566,803
[/TD2][TD2]
-401,427
[/TD2][TD2]
-397,181
[/TD2][TD2]
21,878
[/TD2]
[TD2]-50,000[/TD2][TD2]-65,030[/TD2][TD2]-66,904[/TD2][TD2]0[/TD2]
[TD2]
-516,803
[/TD2][TD2]
-336,397
[/TD2][TD2]
-330,277
[/TD2][TD2]
21,878
[/TD2]
[TD2]167,500[/TD2][TD2]165,212[/TD2][TD2]162,129[/TD2][TD2]148,991[/TD2]
[TD2]167,500[/TD2][TD2]165,212[/TD2][TD2]162,129[/TD2][TD2]156,935[/TD2]
[TD2]
-3.09
[/TD2][TD2]
-2.04
[/TD2][TD2]
-2.04
[/TD2][TD2]
0.14
[/TD2]
[TD2]-516,803[/TD2][TD2]-336,397[/TD2][TD2]-330,277[/TD2][TD2]21,878[/TD2]
[TD2]120,000[/TD2][TD2]116,042[/TD2][TD2]103,717[/TD2][TD2]89,543[/TD2]
[TD2]29,500[/TD2][TD2]0[/TD2][TD2]11,571[/TD2][TD2]0[/TD2]
[TD2]-367,303[/TD2][TD2]-220,355[/TD2][TD2]-214,989[/TD2][TD2]111,421[/TD2]
[TD2]
-2.19
[/TD2][TD2]
-1.33
[/TD2][TD2]
-1.33
[/TD2][TD2]
0.71
[/TD2]