Welcome to Tesla Motors Club
Discuss Tesla's Model S, Model 3, Model X, Model Y, Cybertruck, Roadster and More.
Register

Advanced TSLA Options Trading

This site may earn commission on affiliate links.
Again, this is where TOS shines. You can use the thinkback function or the Oracle. I forgot the names since they've changed quite a few times. Basically whatever backtest function that exist. I remember I had to call support to get them to enable that orange button for me. Might need higher level clearance.

There are also some services out there that offers back testing data. Costs a few hundred dollars per month. i believe. Quantolian might have options data in the future.

Prodigio, an auto trading firm that used to be witny TOS will definitely have tick by tick data.

I use TOS, mostly on my phone now though. I'll use it on my computer to see if I can find the function.

Does anyone have a good TOS training course? There is so much stuff in there that it is way confusing for me. Not to mention I don't know how to make sense of what the benefit is.
 
I use TOS, mostly on my phone now though. I'll use it on my computer to see if I can find the function.

Does anyone have a good TOS training course? There is so much stuff in there that it is way confusing for me. Not to mention I don't know how to make sense of what the benefit is.
Waiting until the afternoon before the earnings will allow you to lose time decay, but the IV rise will more than compensate for it. So, no, its not better to wait. Assuming the stock is at the same price today till Wedesday, options on a highly volatile stock like TSLA are almost always going to be higher wednesday than today. Remember, IV peaks in the hour or two close, and drops within two hours of the open the next day.

Also, believe me, if you think you have found a way to make money with minimal risk (or the risk reward ratios are in your favor), trust me they are not. I have been in HFT for several years, and done some automated trading related research. The algos are much smarter, faster, and have much better access to data then you or me can ever imagine. So always remember that "the odds are forever against you" (to modify the quote of Hunger games) when dealing with any form of derivative product.
 
I use TOS, mostly on my phone now though. I'll use it on my computer to see if I can find the function.

Does anyone have a good TOS training course? There is so much stuff in there that it is way confusing for me. Not to mention I don't know how to make sense of what the benefit is.

If you call TD they will set up a time to talk with one of their experts and give you a personal tutorial of TOS (I am assuming TOS is Think or Swim??)
 
How do verticals work?

When I go into the my trade feed on think or swim I see a lot of these types of trades. Both buying and selling them.

cbe92ff9b5eca0e7022caeaf06821e7f.jpg


How do they work and what is their advantages/disadvantages? What is the logic for picking the strikes?
 
That's just selling a normal put spread. They sold the 240 put and bought the 237.5 put as downside protection. Looks like they net 0.15 dollars per, and they did 100 of them so 1500 dollars net. Doesn't seem like a great trade. The downside is 2.50 loss *100, or 25000 dollars (less the 1500 gained, so 23500) if tesla falls to 237.5. My opinion is that the bid ask spread is stealing too much of your profit when you pair puts that are that close together. You lose prob 0.10 or 0.20 bid/ask spread on both options and only make 0.15. Based on that, the option play should be netting you 0.5 or so if you remove the amount that market makers are stealing from you. If you got 0.5 for that sort of trade, it would be appropriately priced. I'm not sure what the -10 means, perhaps I'm wrong that this person did 100 contracts and maybe they did 10. If that's the case, i don't know what the 100 is in there for. CBOE is the routing to the chicago board of options.

by the way, this is my interpretation of what was posted. please correct anything that needs correcting.
 
That's just selling a normal put spread. They sold the 240 put and bought the 237.5 put as downside protection. Looks like they net 0.15 dollars per, and they did 100 of them so 1500 dollars net. Doesn't seem like a great trade. The downside is 2.50 loss *100, or 25000 dollars (less the 1500 gained, so 23500) if tesla falls to 237.5. My opinion is that the bid ask spread is stealing too much of your profit when you pair puts that are that close together. You lose prob 0.10 or 0.20 bid/ask spread on both options and only make 0.15. Based on that, the option play should be netting you 0.5 or so if you remove the amount that market makers are stealing from you. If you got 0.5 for that sort of trade, it would be appropriately priced. I'm not sure what the -10 means, perhaps I'm wrong that this person did 100 contracts and maybe they did 10. If that's the case, i don't know what the 100 is in there for. CBOE is the routing to the chicago board of options. by the way, this is my interpretation of what was posted. please correct anything that needs correcting.
-10 means selling 10 contracts. i.e. 1000 equivalent shares if exercised. Using verticles is a newbie mistake, or done when in a pinch to execute fast. It also combine the comission of both legs together, which makes it great for >100 contracts. The safer method is to do it one leg at a time. The commission is not worth saving at small volume when compared to the loss to bid ask spread. Another problem of the verticle is that TOS will wait for all condition of the order to be met before executing the option. So when you click on sell verticle in TOS, the program actually send out the two legs as limit order. If the stock is moving too fast, one side of the limit order might never be met and the order will get stuck. If you do a market vertical, then may the devil have your soul. Never market order an option.
 
That's just selling a normal put spread. They sold the 240 put and bought the 237.5 put as downside protection. Looks like they net 0.15 dollars per, and they did 100 of them so 1500 dollars net. Doesn't seem like a great trade. The downside is 2.50 loss *100, or 25000 dollars (less the 1500 gained, so 23500) if tesla falls to 237.5. My opinion is that the bid ask spread is stealing too much of your profit when you pair puts that are that close together. You lose prob 0.10 or 0.20 bid/ask spread on both options and only make 0.15. Based on that, the option play should be netting you 0.5 or so if you remove the amount that market makers are stealing from you. If you got 0.5 for that sort of trade, it would be appropriately priced. I'm not sure what the -10 means, perhaps I'm wrong that this person did 100 contracts and maybe they did 10. If that's the case, i don't know what the 100 is in there for. CBOE is the routing to the chicago board of options.

by the way, this is my interpretation of what was posted. please correct anything that needs correcting.

I think it means they sold to close 10 contracts. My TD account always puts the 100 in there, that's the 100 shares that is in the standard option contract.

This was the only trade like this that I saw today, on some other high volitility days I have seen many of them both buying and selling and on both calls and puts. These are about the only types of trades I see in the my trade feed area so I was wondering what made them so popular.

They're probably not that popular. But the owner of the trading service probably wants to push and highlight them since it promotes trading in general and two comissions?
 
They're probably not that popular. But the owner of the trading service probably wants to push and highlight them since it promotes trading in general and two comissions?

It looks like it's a Twitter type feed for trades. When I buy or sell it asks me if I would like to share it with my trade. I always say no. I see them from many different users when I look at the feed on high volume days.
 
Hi Dave,

Forgive me if you have already moved on.
I'm currently 70% in stock, 20% in Jan 15 LEAPS, 10% in shorter term options (from Sept 13 to Jan 14), and using no margin. Stock was purchased in 2nd half of 2012 and most LEAPS/options were purchased in May.

For future, I'm confused. I want to add more risk to just holding 100% stock in return for the possibility of owning double the shares in 5 years than if I would have just held 100% stock. I'm thinking of the following ongoing strategies:

Strategy #2: When stock price dips significantly (ie., 20% from highs), I will use margin to buy short-term options (about 3-6 months out). If/When stock price recovers and reaches new highs, I will sell options and wait for next dip. In this scenario, I'll pay income tax on all my gains using this approach. I'm hesitant because I'm already at a high income tax bracket, so the % of profit given to taxes will be quite high. I'm not sure if this strategy is worth it. It's higher risk (and stress), but perhaps higher reward.

Do you guys have any thoughts or advice?
I agree with buying on dips for long-term, but not for short-term!

For short-term I think this makes more sense:
MitchJi said:
My method (the "counting cards" method for short term trades):
In Blackjack the dealer is required to take a card if his hand is 16 or lower, so when there is a higher percentage of face cards remaining the odds shift in your favor, so you should raise your bet. Each individual bet is a gamble but overall you are not gambling because the odds are in your favor. In the same way I think there are times that many members on this forum can identify, when if you raise your bet (buy short or medium term options) the odds are in your favor.
Robert's response to that:
Robert.Boston said:
You need to pay attention to different facts as an investor vs. trader. Investors should assess the long-run success factors of a company; if those are right, then you don't need to sweat the day-to-day price movements. (But you do need to keep an eye on whether the company is continuing to execute on its plan, and that the plan is still sound.) Traders care less or not at all about the company's overall arc to success; instead, they are trying to find gaps in information. For example, we on TMC collectively got the Q2 deliveries almost exactly right, so careful readers knew what the market didn't and could have profited from the strong uptick last week when Tesla formally announced the number. As an investor, I didn't particularly care that Tesla modestly over-achieved its delivery target (which I thought they sandbagged in the first place). But for those who day-trade, buying some weekly calls early in the week and then selling on the news would have been profitable.
Of course combining buying on dips with the strategy I suggested above is even better if the timing is correct. And now might be a good time to try that if you share my opinion that the next 3-6 month's are an unusually good opportunity to profit (long) on Tesla.
 
I was looking at IV for the At the Money options around the end of quarter delivery numbers. Here is what I found for the $235 calls:

Jun 24th: 27.73 %
Jul 1st: 29.98 %
Jul 8th: 29.58 %
Jul 15th: 29.77 %

You see a small spike for the 1st, even though I doubt we will get the numbers that day. You then see a slight decline after that, but still ~2% higher than the June 24th IV.

I don't think the market is pricing in the delivery number reveal if there is only a 2% higher IV post delivery numbers. Looking at the last quarter isn't that helpful because of the Model III event. Using the OptionsHouse volatility chart it appears that the delivery reports 3 quarters before the last (January, October, July 2015) saw an IV run up of about 5% during the 2 weeks before the numbers were released and then volatility went up even more after the numbers release. This reaction post news is opposite of earnings, which usually sees IV go down after release.

Considering we are 3 weeks before delivery numbers I think there is a good chance IV will go up like it has the last 3 quarters, especially because IV is on the lower side when looking at it's 52 week range.

This knowledge might give one a trading edge when doing options trades. For example, it might work out well to do a call calendar spread with the July 1st options and July monthlies. The July 1st calls are over inflated by 2% if the delivery number doesn't come out on the 1st. This means the July 1st call should lose value a lot faster than the July monthlies thanks to a stronger theta decay and volatility increase keeping up the value of the monthlies.

This strategy would also work for puts. In fact, I think it would be a better trade for puts as I doubt TSLA will tank leading up to the delivery numbers barring some bad news coming out and in that case the July 1st put will expire worthless and you end up with what is basically a reduced cost put for July 15th. This reduced cost put can hedge your long position into delivery numbers or you can sell for a profit it if you are up on the position thanks to IV expansion.

Whether you choose puts or calls, in either case if there is a strong move then you would actually have theta decay move against you and you will have a large loss if held to expiration (however it is a defined risk trade). Using September calls instead of July calls would give you a wider range for potential profit and you could continue to sell new calls against your September calls all the way up to September to try and better your cost basis.

WARNING: I have not tried this trade before and am not recommending it. I've been doing some more advanced options learning as what I've been doing lately hasn't been working out real well for me and thought I would share some of that knowledge with everyone (and maybe get corrected by those with more experience!) I thought I would start some discussion in this thread because it seems that most people are just buying and then closing out straight calls and/or buying puts to hedge. I think we can be smarter than that?
 
The bid ask sucks on this example according to the Bid/Ask I'm seeing after hours but here are some P&L graphs of a $235 put calendar to get my point across. One shows as of now, the other is with an assumed 10% absolute increase in the IV in the July monthly option. You would have theta decay working in your favor as well as long as you stayed in the green range.
 

Attachments

  • putcalendar.JPG
    putcalendar.JPG
    32.5 KB · Views: 38
  • IVincrease.JPG
    IVincrease.JPG
    62.3 KB · Views: 36
IV is still on the lower end compared to the IV over the last year. TSLA's volatility is 14% of it's highest volatility over the last 52 weeks. This is a misleading number because of the crazy volatility we had in February due to the crash in the share price, as you can see in the first chart. IV percentile is a better value to look at in this case. If you looks at the IV percentile, IV has been lower 41.9% of the time over the last 52 weeks. I expect the delivery numbers to raise IV and the ER to raise IV. Now that we are 2 weeks until the delivery numbers it may be a good time to start thinking about putting in a volatility based trade. I also uploaded the volatility chart where I put in a red line approximately 2 weeks before prior delivery numbers we have had over the last year.

TSLA12monthVolatility.JPG
2weeksbefore.jpg


IVstats.JPG
 
What I mean by volatility based trade in this case is one in which you are long volatility (long Vega). In its simplest form, you are long Vega anytime you buy an option. You could just go out and buy a load of calls and puts and hope you make money when Vega inflates but while you wait for this to happen your options will lose value to time (Theta) decay and they will be subjected to the whims of stock price movement (Delta), which could either be very good or bad for your position.

To minimize the effects of Theta and Delta you can short options against your long options as anytime you are short an option you will have the opposite effects of buying an options. For this situation, you ideally want to construct a trade in which you are long Vega, but you have Theta working FOR you, not AGAINST you. To do this you want to short options that have higher Theta decay than the options you are long. As far as delta, ideally you want it to be near zero if you are trying to do a pure volatility play but you can either make them positive deltas if you think the stock is going to go up or negative deltas if you think the stock may go down or want to balance out and hedge a bullish portfolio.

Overall, you will make money as time goes on and volatility goes up. You will lose money if volatility goes down. You may also lose or make money due to stock price movement depending on what Deltas you chose and the stock price movement. If you choose a neutral Delta then the stock price will have to more a lot more for you to lose money due to stock movement than if you bought naked options.

You will not make nearly as much money on a play like this than buying naked options but you are probably more likely to profit. It also is a good strategy to use for hedging if the stock price doesn't move or moves opposite the direction the rest of your portfolio needs to go to profit.
 
I thought I would give an update on the volatility trades I'm attempting. I continue to see people only use options for leverage and hedging so hopefully my posts get the group to come up with some new ideas. I am not the most knowledgeable person in this area but would like to continue to learn as much as possible (you can see I started the newbie options thread as a options newbie 3 years ago).

One trade I tried was a July/August $230 call calendar that will most likely be a loss. I put that trade on June 13th when TSLA was trading ~$220. It has a $20 range in which is will be profitable and based on the delivery numbers it looks like we will likely end up below that range. Once the July call I shorted becomes worthless I can continue to write calls against the August calls and maybe the ER will save the long side of the trade but I think I will be lucky at this point if that happens. The good news is that I will end up losing less money than if I had bought straight August $230 calls.

A more interesting trade I've attempted is an August/September $215 put calendar. I placed this trade on June 16th when TSLA was ~ $215. This trade is even more purely based on volatility. As I posted in my previous posts I've noticed 2 weeks before delivery numbers being reported that I've noticed volatility going up and then continuing up after the release of the numbers. I've attached a picture of how the trade looks as of Friday. What was interesting was that after suspension gate, Brexit, and the SCTY offer that even with the drops the trade did not lose much money, thanks to the corresponding increase in Volatility (Vega).

When I put the August/September $215 put calendar on TSLA IV was ~38%. It is now ~48%. My put calendar is up 35.7% even though the stock is at pretty much the same price as when I put the trade on two weeks ago. The pattern of a rise in IV before delivery number release came true once again. Hopefully IV continues to go up this week as is has in the past after delivery number release but it may not because Suspensiongate/Brexit/SCTY offer may have already raised IV as high as it is going to go for right now. On the other hand, based on bad delivery numbers and the ER in a month I think IV will continue to rise at least a few more percent.

My conclusions so far are that the shorter term calendars don't have enough wiggle room to withstand violent swings in stock price. I was hoping a $20 profit range would work out but it's looking like that won't be the case. The longer term calendars look better for capturing rises in Vega. By having a longer term calendar you have a much larger range to be right. In the August/ September calendar, for example, I have a breakeven range from $184.65-$254.05. It's possible to fall outside this range but I think there is a really good chance to be in this range over the next ~2 months. I don't plan to hold it that long but will if I need to. Some negatives I can think of for the longer term calendar is Theta (time) decay doesn't work as fast as a shorter term calendar, liquidity isn't as good, and there's more time for you to end up being wrong due to a black/white swan event.

.
putcalendar7.4.16.JPG
volatility7.4.16.JPG
 
I moved this discussion out of the short term thread.

I was looking to the option chain of SCTY this morning and I had an idea that probably has some flaw in it, but I can't find it. The problem is that normally you can have a high risk investment that has upside and downside, or you can have a low risk investment with a low downside but also a limited upside, but can never have the best of both worlds. But this idea seems to have a maximum loss of $1050,00 and a maximum upside of $7950,00.

You can sell a $24,00 Jan 2017 put for SCTY for $8,15 and buy a $21,00 Jan 2017 put for SCTY for $5,50. This means that you have a maximum loss of $3,00, but you already have gained $2,65. So your maximum loss is $0,35 (or 13,2% of your maximum gain).

... ignoring the bit about converting to TSLA...

...will be more than 13,2%, this should be a good deal. Or not?!

I am quite confused at the moment, but if I haven't made a logical misstep this could be quite a good opportunity for those who think that the deal will go through and TSLA won't plummet in the next two quarters.
I've never actually done complicated options trades like this. Actually this is relatively simple spread compared to people who do iron condors etc, but my point is that my options trades are usually one-sided. But your example piqued my interest, and I have a spare afternoon.

First, I tried to reproduce your actual numbers. Now, my broker is ETrade, and maybe the quotes are broker specific. And, I'm completely ignoring the TSLA part of your logic above, just talking about the raw SCTY trade.

The first thing is that your $8.15 was the last trade of the $240 puts. However, the Bid/Ask is $6.80/$7.80. That is, the stock moved without the options trading again. Realistically you might get $7.30 for this put (the average of the bid/ask spread).
The $21 puts did trade. The b/a spread is $5/$6, last trade $5.50 as you show.

Above, you calculate maximum risk as $3 (which is the difference between the two strike prices) less $1.80 (the money you already got), so the maximum loss is $1.20. The maximum return is when you get to keep all of that $1.80. So your maximum loss is actually 67% of your maximum gain. Failing to take into account the lack of trading of the write-side option is where your calculation went wrong. You would be right if you could actually execute the trades as you wrote them, but without further movement in the underlying stock you'll never be able to do that. Actually, movement in SCTY will tend to move both ends of the trade, so you'll probably never be able to do it. In fact, even my trade might be impossible.

This is one of my big problems with "paper trading", which a lot of people recommend to beginners. It is easy to convince yourself that you'd have made a fortune if only you had real money, but in reality either the trades wouldn't ever have happened or you'd get the timing wrong or something. All you can count on is that you'll never make as much as you thought you would. And the fortune you make may be negative :).

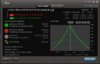
The good thing about this is that, like you, I followed the link to optionsprofitcalculator.com (thanks @MitchJi) and learned a lot about how the time value affects early exit from a trade like this. Suppose the deal goes through and on July 30 SCTY goes instantly to $26. You could probably exit both puts and get 12.5%, in only 3 weeks. Of course you'd make a lot more by ignoring the lower strike, and just selling the at-the-money puts, but then your downside insurance is all gone. If the deal tanks and SCTY goes down to $21, I can probably exit for only 15%. Note the disparity... time value works against us here.

The next good thing is that I knew ETrade allowed me to do these kinds of trades, but I'd never tried one. The way it works is I enter both ends of the spread, but instead of pricing the individual trades I just say "I want to get $2" (a little up from $1.80). This makes my downside $1 and upside $2, for a slightly better outcome. Of course the trade might never execute. I put it in for 10 contracts of each. We'll see, and I'll report back.
 
One more thing about that trade (I have not bothered to analyze if this has a positive or a negative effect on the trade, my guess is positive) is that the high put price is due to the IV, not the SP. Which means that it could easily go away (and probably will) without a corresponding change in the SP.
 
TSLA's volatility has spiked to one of the highest points it's been in the last year at an IV of 58.6%. I was hoping it would go up at least a few more percent after delivery numbers and was shooting for 5% but it looks like the delivery report rose IV by 10.6%! The current IV was matched a few times over the last 52 weeks but only greatly surpassed during the February SP crash as you can see on the chart below.

My Short August/Long September $215 Put Calendar spread is now trading at $4.325. I originally purchased it for $2.45. That means it is now up 76.5%. Last week it was up 35.7% and TSLA was at about the same share price as it close this week and surprisingly close to when I bought it back in June. The amount Volatility can affect a calendar has really surprised me! From here I don't know if Volatility will maintain it's high value until earnings or not. It would probably be smart to book some profits at this point but I think the upcoming ER and the pending SCTY offer will keep IV high. Luckily time decay is in my favor as I am short the nearer term option. While I may lose some of my gains if Vega goes back down I will make up for it a little bit from Theta decay.

]
volatility7.9.16.JPG
o
 
The next good thing is that I knew ETrade allowed me to do these kinds of trades, but I'd never tried one. The way it works is I enter both ends of the spread, but instead of pricing the individual trades I just say "I want to get $2" (a little up from $1.80). This makes my downside $1 and upside $2, for a slightly better outcome. Of course the trade might never execute. I put it in for 10 contracts of each. We'll see, and I'll report back.
Indeed, it expired unfilled.