Record Global Temperatures and U.S. Billion-Dollar Disasters | Climate Central
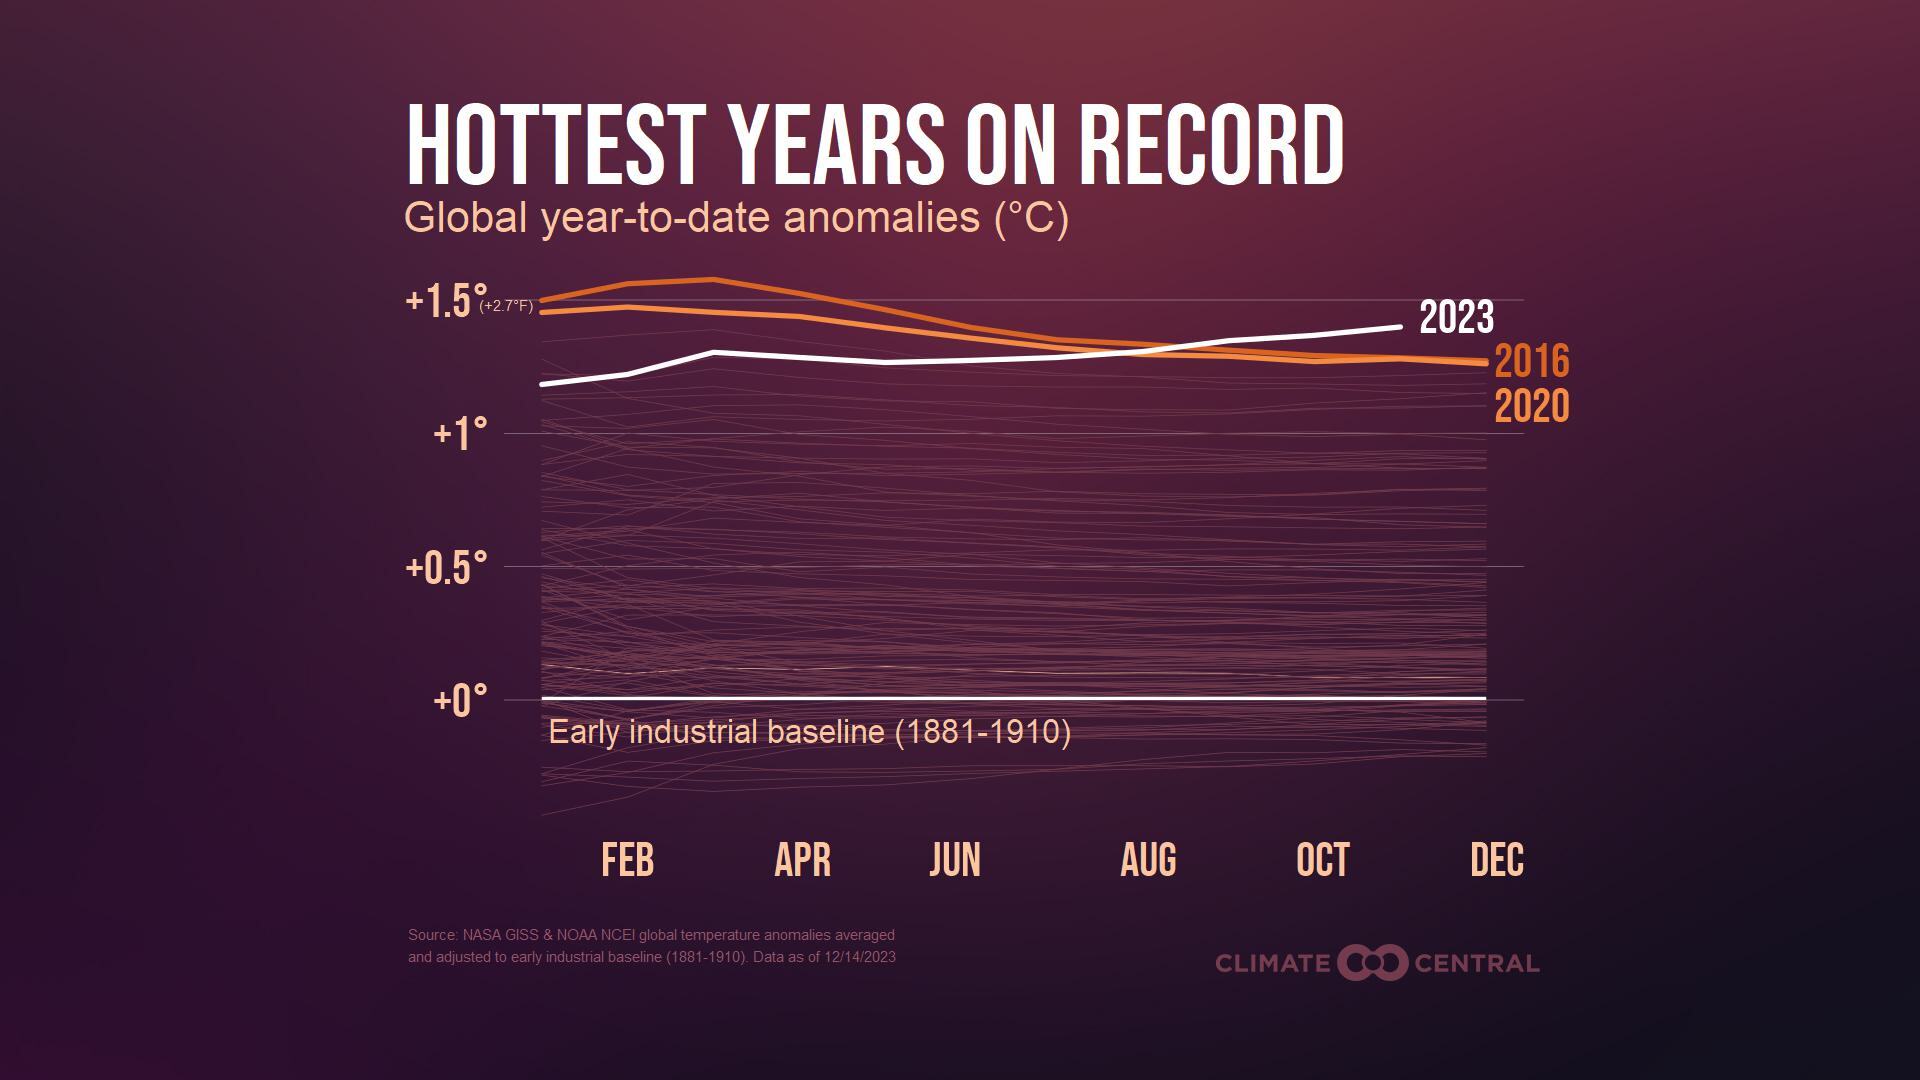
2023 has been a record year for carbon pollution, global temperatures, and U.S. billion-dollar disasters
 www.climatecentral.org
As the planet warms, many dangerous extreme events are becoming more frequent and intense.
The U.S. has experienced a record 25 billion-dollar weather and climate disasters so far in 2023.
The frequency of billion-dollar disasters has increased dramatically since 1980.
The average time between billion-dollar disasters in 2023 (through November) was just 10 days.