


Welcome to Tesla Motors Club
Discuss Tesla's Model S, Model 3, Model X, Model Y, Cybertruck, Roadster and More.
Register
Install the app
How to install the app on iOS
You can install our site as a web app on your iOS device by utilizing the Add to Home Screen feature in Safari. Please see this thread for more details on this.
Note: This feature may not be available in some browsers.
-
Want to remove ads? Register an account and login to see fewer ads, and become a Supporting Member to remove almost all ads.
You are using an out of date browser. It may not display this or other websites correctly.
You should upgrade or use an alternative browser.
You should upgrade or use an alternative browser.
Near-future quarterly financial projections
- Thread starter luvb2b
- Start date
Fact Checking
Well-Known Member
I'm finding it really hard to accept that short interest has remained steady despite the recent run up in TSLA share price.
How is the best number calculated, and how often ?
The bi-weekly reports should be very accurate in terms of equities short position, it's reported back to Nasdaq by market makers.
I believe what is happening is similar to what happened in 2013: some shorts are getting squeezed, but new shorts are jumping on the all-time-highs of an "blatantly overvalued company". Then those new shorts are taken out too, while collective short interest never drops dramatically.
In 2013 there was an epic short squeeze from ~$40 to ~$190 that took about 5 months to play out until late 2013 the last round of new shorts had the final say about the peak valuation of (at that time) obviously overvalued company.

To recap the 2013 short squeeze on the weekly chart:
A bullish macro environment in the second half of 2013 was also conductive to the short squeeze:
The +30% rally in most other equities gave shorts a lot of new trading power to short TSLA.
Last edited:
SageBrush
REJECT Fascism
Is that the data that @Papafox is relaying through the charts of Ihor something or other ?The bi-weekly reports should be very accurate in terms of equities short position, it's reported back to Nasdaq by market makers.
If so, he has said repeatedly that the data is polluted by combination reporting, meaning that if any transaction of any company included in the report was a short, then all the companies are so tagged.
I've thought about the notion of old shorts leaving and new shorts coming in. It is possible but it implies an impressive pool of new gamblers who are even more speculative than the old ones, albeit gamblers who have not been burned by their old TSLA short holdings.
Use this thread for quarterly projections only, not for a discussion about short interest.
twitter case study is a good one.
there is a pool of hedge funds that does index arb trading, and some large cap managers who take active weightings work around that as well. in recent years the number of hedge funds is down and active managers have lost assets to index funds.
so comparatively, the difference between the number of dollars that will "need to buy" on an index add vs the number of professional dollars available to front run the trade is probably as wide as its ever been.
but there's another problem, tesla brings big volatility. an arbitrageur putting on a $100m of long tesla vs. short s&p for an index add is probably taking meaningful var on his trade book, this forces somewhat lower size. the pool of existing arbs is not going to be able to front run in the same size they normally would (i think) due to this volatility aspect.
this year you will also have tesla finally crossing to a ttm profit, and that also brings a slew of earnings momentum investors who usually have positive earnings as a pre-requisite to buy.
all this, plus it's a bull market you know.
Very interesting, and this largely rhymes with this recent analysis by @ReflexFunds.
He also pointed out the fact that because Tesla isn't in the S&P 400 either, there's an even larger 'gradient' between fund ownership of TSLA before and after the inclusion event.
This brings me to the following topic - the magnitude of the move. There was one recent S&P 500 inclusion of a large cap company, the 2018 inclusion of Twitter (TWTR).
Here are the events as I understand them:
Here's the daily chart history of the ~three months of TWTR price changes from April ~20 to July:
- 2018, April 25, Twitter posts Q1 profits of $61m, narrowly meeting the 12-months profitability condition of S&P 500 inclusion, the sum of the last four quarters is $14m.
- 2018, June 4, after trading closes, the S&P 500 index inclusion announcement by the S&P index committee:
- 2018, June 5, in early trading TWTR breaks out already on the news:
Here's the macro environment in that timeframe, Nasdaq futures - it was mostly supportive of any TWTR price moves:
Note the various pricing anomalies:
The over +60% rise of TWTR from $29 to $47 was meteoric - and I'd say in large part related to the S&P 500 inclusion event. What's surprising to me is how little this was arbitraged apparently.
- On the day of the Q1 announcement there was no meaningful price reaction to the meeting of the S&P 500 criteria: in fact TWTR dropped and closed at $29. Did the market not realize that this happened? Was there some doubt about Twitter's inclusion?
- Almost a full month passed and TWTR traded on average volume in a tight 10% band - despite Nasdaq rises being supportive of bigger price moves.
- June 1: uptick in trading volume and breakout from previous range.
- June 4, on the day of the S&P committee announcement, TWTR closes on a nice up-move $37.
- June 5, all hell breaks lose and the big rally continues: stock closes on $39.
- June 15, on the 9th trading day after the S&P 500 inclusion, TWTR reaches the top and ATH of $47.
- In the weeks following the S&P 500 inclusion TWTR daily trading volume doubles compared to the pre-inclusion period, despite markets entering the more quiet, lower volume summer lull.
Also note that the obvious arbitrage trade of selling TWTR on the day of the index inclusion didn't result in a drop of the price, the rally continued another 9 days with another +20% up-move.
Also, Twitter had a market cap of $22b - Tesla is going to have 4x the market cap or more on inclusion ...
(Also, I couldn't find any information on whether Twitter was included in the larger S&P 400 index already in June 2019.)
i've been off the forum for a while but still have my modeling for the company. i attached an update below. street estimates still look too low for the december quarter. there's an upside surprise catalyst in that i have not modeled additional credits from the fiat/chrysler deal. i would expect some of that deferred revenue to start flowing through this quarter. once we have some clarity i would be able to think more intelligently about the future periods. my guess is around $100m/quarter, so that would be around another 50c in gaap eps vs what i have shown.
i also haven't added the impact of solarcity installations/revenue increasing profitably. not sure that could happen this quarter. with the hiring the opex may go up there.
i am positioning for an s&p 500 index addition in 2020. i think any good active large cap manager would be aware of this, and it sets up a very natural trade for them in the stock. most active large cap managers are benchmarked to the s&p - and here's the easy outperformance trade based on the s&p index addition: underweight apple, and take tesla to a weight above what it would be if included in the index. on the day tesla is added to the s&p, sell the extra tesla and renormalize your apple weight (or whatever other stocks you underweighted). i think that's part of the reason we have this nonstop lift, you're seeing a huge amount of active managers almost being forced to buy. when it's added to the index, the index trackers will be forced to buy.
[TD2] luv est [/TD2][TD2] tsla [/TD2][TD2] tsla [/TD2][TD2] tsla [/TD2] [TD2] Dec-19 [/TD2][TD2] Sep-19 [/TD2][TD2] Jun-19 [/TD2][TD2] Mar-19 [/TD2] [TD2]10,000[/TD2][TD2]8,741[/TD2][TD2]8,787[/TD2][TD2]6,000[/TD2] [TD2]9,450[/TD2][TD2]8,742[/TD2][TD2]8,935[/TD2][TD2]6,091[/TD2] [TD2] 19,450 [/TD2][TD2] 17,483 [/TD2][TD2] 17,722 [/TD2][TD2] 12,091 [/TD2] [TD2] 92,550 [/TD2][TD2] 79,703 [/TD2][TD2] 77,634 [/TD2][TD2] 50,900 [/TD2] [TD2] 87,000 [/TD2][TD2] 79,837 [/TD2][TD2] 72,531 [/TD2][TD2] 62,950 [/TD2] [TD2] 0.07 [/TD2][TD2] 0.08 [/TD2][TD2] 0.06 [/TD2][TD2] - [/TD2] [TD2] 0.14 [/TD2][TD2] 0.15 [/TD2][TD2] 0.10 [/TD2][TD2] 0.11 [/TD2] [TD2] 95.00 [/TD2][TD2] 95.18 [/TD2][TD2] 97.21 [/TD2][TD2] 113.65 [/TD2] [TD2] 50.00 [/TD2][TD2] 50.00 [/TD2][TD2] 50.00 [/TD2][TD2] 54.00 [/TD2] [TD2] 1.22 [/TD2][TD2] 1.38 [/TD2][TD2] 1.17 [/TD2][TD2] 3.18 [/TD2] [TD2]0[/TD2][TD2]0[/TD2][TD2]0[/TD2][TD2]15,412[/TD2] [TD2]1,589,065[/TD2][TD2]1,417,644[/TD2][TD2]1,545,857[/TD2][TD2]1,219,184[/TD2] [TD2]4,303,575[/TD2][TD2]3,550,356[/TD2][TD2]3,575,051[/TD2][TD2]2,574,076[/TD2] [TD2]240,100[/TD2][TD2]221,000[/TD2][TD2]208,362[/TD2][TD2]215,120[/TD2] [TD2]137,000[/TD2][TD2]134,000[/TD2][TD2]111,219[/TD2][TD2]215,981[/TD2] [TD2]20,000[/TD2][TD2]30,000[/TD2][TD2]-64,100[/TD2][TD2]-500,500[/TD2] [TD2] 6,289,740 [/TD2][TD2] 5,353,000 [/TD2][TD2] 5,376,389 [/TD2][TD2] 3,723,861 [/TD2] [TD2]280,250[/TD2][TD2]281,430[/TD2][TD2]244,850[/TD2][TD2]129,094[/TD2] [TD2]101,844[/TD2][TD2]120,570[/TD2][TD2]123,358[/TD2][TD2]195,567[/TD2] [TD2]0[/TD2][TD2]0[/TD2][TD2]0[/TD2][TD2]0[/TD2] [TD2]575,000[/TD2][TD2]548,000[/TD2][TD2]605,079[/TD2][TD2]492,942[/TD2] [TD2] 7,246,834 [/TD2][TD2] 6,303,000 [/TD2][TD2] 6,349,676 [/TD2][TD2] 4,541,464 [/TD2] [TD2]1,223,580[/TD2][TD2]1,102,708[/TD2][TD2]1,264,570[/TD2][TD2]1,051,304[/TD2] [TD2]3,442,860[/TD2][TD2]2,911,292[/TD2][TD2]3,038,793[/TD2][TD2]2,213,705[/TD2] [TD2]127,253[/TD2][TD2]117,000[/TD2][TD2]106,322[/TD2][TD2]117,092[/TD2] [TD2]0[/TD2][TD2]0[/TD2][TD2]-49,600[/TD2][TD2]-408,800[/TD2] [TD2] 4,793,693 [/TD2][TD2] 4,131,000 [/TD2][TD2] 4,360,085 [/TD2][TD2] 2,973,301 [/TD2] [TD2]221,398[/TD2][TD2]215,133[/TD2][TD2]224,369[/TD2][TD2]159,456[/TD2] [TD2]83,512[/TD2][TD2]98,867[/TD2][TD2]101,154[/TD2][TD2]157,431[/TD2] [TD2]11,000[/TD2][TD2]11,000[/TD2][TD2]11,000[/TD2][TD2]11,000[/TD2] [TD2]678,500[/TD2][TD2]656,000[/TD2][TD2]732,022[/TD2][TD2]674,533[/TD2] [TD2] 5,788,103 [/TD2][TD2] 5,112,000 [/TD2][TD2] 5,428,630 [/TD2][TD2] 3,975,721 [/TD2] [TD2] 1,458,731 [/TD2][TD2] 1,191,000 [/TD2][TD2] 921,046 [/TD2][TD2] 565,743 [/TD2] [TD2]23.0%[/TD2][TD2]22.2%[/TD2][TD2]18.2%[/TD2][TD2]13.8%[/TD2] [TD2]23.8%[/TD2][TD2]22.8%[/TD2][TD2]18.9%[/TD2][TD2]20.2%[/TD2] [TD2]47.0%[/TD2][TD2]47.1%[/TD2][TD2]49.0%[/TD2][TD2]45.6%[/TD2] [TD2]32.0%[/TD2][TD2]32.3%[/TD2][TD2]26.6%[/TD2][TD2]33.9%[/TD2] [TD2]20.0%[/TD2][TD2]18.0%[/TD2][TD2]15.0%[/TD2][TD2]14.0%[/TD2] [TD2]21.8%[/TD2][TD2]20.4%[/TD2][TD2]17.3%[/TD2][TD2]15.6%[/TD2] [TD2]21.0%[/TD2][TD2]23.6%[/TD2][TD2]8.4%[/TD2][TD2]-23.5%[/TD2] [TD2]18.0%[/TD2][TD2]18.0%[/TD2][TD2]18.0%[/TD2][TD2]19.5%[/TD2] [TD2]-100.0%[/TD2][TD2]-100.0%[/TD2][TD2]-100.0%[/TD2][TD2]-100.0%[/TD2] [TD2]-18.0%[/TD2][TD2]-19.7%[/TD2][TD2]-21.0%[/TD2][TD2]-36.8%[/TD2] [TD2]315,000[/TD2][TD2]304,000[/TD2][TD2]293,898[/TD2][TD2]295,174[/TD2] [TD2]525,000[/TD2][TD2]506,000[/TD2][TD2]557,261[/TD2][TD2]573,929[/TD2] [TD2]0[/TD2][TD2]0[/TD2][TD2]117,345[/TD2][TD2]43,471[/TD2] [TD2]30,000[/TD2][TD2]30,000[/TD2][TD2]30,000[/TD2][TD2]45,000[/TD2] [TD2]90,000[/TD2][TD2]90,000[/TD2][TD2]90,000[/TD2][TD2]130,000[/TD2] [TD2] 960,000 [/TD2][TD2] 930,000 [/TD2][TD2] 1,088,504 [/TD2][TD2] 1,087,574 [/TD2] [TD2] 498,731 [/TD2][TD2] 261,000 [/TD2][TD2] -167,458 [/TD2][TD2] -521,831 [/TD2] [TD2]15,000[/TD2][TD2]15,000[/TD2][TD2]10,362[/TD2][TD2]8,762[/TD2] [TD2]-132,000[/TD2][TD2]-132,000[/TD2][TD2]-118,979[/TD2][TD2]-104,453[/TD2] [TD2]-53,000[/TD2][TD2]-53,000[/TD2][TD2]-53,000[/TD2][TD2]-53,000[/TD2] [TD2]0[/TD2][TD2]85,000[/TD2][TD2]-40,756[/TD2][TD2]25,750[/TD2] [TD2]0[/TD2][TD2]0[/TD2][TD2]0[/TD2][TD2]0[/TD2] [TD2] 328,731 [/TD2][TD2] 176,000 [/TD2][TD2] -369,831 [/TD2][TD2] -644,772 [/TD2] [TD2]26,000[/TD2][TD2]26,000[/TD2][TD2]19,431[/TD2][TD2]22,873[/TD2] [TD2] 302,731 [/TD2][TD2] 150,000 [/TD2][TD2] -389,262 [/TD2][TD2] -667,645 [/TD2] [TD2]7,000[/TD2][TD2]7,000[/TD2][TD2]19,072[/TD2][TD2]34,490[/TD2] [TD2] 295,731 [/TD2][TD2] 143,000 [/TD2][TD2] -408,334 [/TD2][TD2] -702,135 [/TD2] [TD2]181,500[/TD2][TD2]179,000[/TD2][TD2]176,654[/TD2][TD2]172,989[/TD2] [TD2]190,000[/TD2][TD2]184,000[/TD2][TD2]176,654[/TD2][TD2]172,989[/TD2] [TD2] 1.56 [/TD2][TD2] 0.78 [/TD2][TD2] -2.31 [/TD2][TD2] -4.06 [/TD2] [TD2]295,731[/TD2][TD2]143,000[/TD2][TD2]-408,334[/TD2][TD2]-702,135[/TD2] [TD2]200,000[/TD2][TD2]199,000[/TD2][TD2]209,863[/TD2][TD2]208,378[/TD2] [TD2]0[/TD2][TD2]0[/TD2][TD2]0[/TD2][TD2]0[/TD2] [TD2]495,731[/TD2][TD2]342,000[/TD2][TD2]-198,471[/TD2][TD2]-493,757[/TD2] [TD2] 2.61 [/TD2][TD2] 1.86 [/TD2][TD2] -1.12 [/TD2][TD2] -2.85 [/TD2]
… … s deliveries x deliveries s+x deliveries 3 deliveries 3 production lease 3s % veh lease s/x % veh avg price s+x (calc'd) avg price model 3 (set) non-zev credits per delivery zev credits revenue auto sales ex 3 auto sales mod 3 auto leasing zev+nonzev credits 1 time revenue total auto energy storage solarcity grohmann services/other total revenue cost of revenue auto sales ex 3 auto sales mod 3 auto leasing 1 time cogs total auto energy storage solarcity grohmann services & other total cost of rev gross profit auto ex 3 ex credits gm auto gaap gm auto lease gm auto gaap ex 3 gm model 3 gm ex credits auto-credits incl 3 gm storage gm scty gm maxwell/grohmann services gm opex tesla r&d tesla sg&a 1 time costs solarcity r&d solarcity sg&a total opex op income interest inc interest exp scty interest other income exp 1time scty gain pretax income income tax net income non-cont int. net inc to common basic shares diluted shares diluted gaap eps gaap net income + stock based comp + one time scty non-gaap net income non-gaap diluted eps
@luvb2b Is there a reason why you are not raising ASP for Model S/X but keeping it steady at 95k? Earlier quarters saw some steep discounting, especially during the last weeks, but in Q4 we've not seen any evidence of Tesla trying to get rid of stock with discounts. Shouldn't this translate into a higher ASP?
Same for Model 3, no evidence of discounts. If fact, it actually saw a few price increases during the quarter. And the SR+ pent-up demand probably peaked in earlier quarters. But you are keeping ASP steady at 50k.
Do you prefer using conservative estimates?
Thekiwi
Active Member
What is everyone using for income tax rate on profitable quarters going forward? does Tesla have a large amount of offsetting tax losses from pass quarters that will reduce tax bill in 2020?
EVNow
Well-Known Member
Tesla has accumulated deficits of $6B. It would take 2 or 3 years to wipe that off. Amazon still doesn't pay any income tax.What is everyone using for income tax rate on profitable quarters going forward? does Tesla have a large amount of offsetting tax losses from pass quarters that will reduce tax bill in 2020?
But they have to pay income tax in other countries.
Thekiwi
Active Member
Tesla has accumulated deficits of $6B. It would take 2 or 3 years to wipe that off. Amazon still doesn't pay any income tax.
But they have to pay income tax in other countries.
Thanks for replying. I did think it was a bit strange they were paying income tax on Q1 & Q2 results, when there were large net losses.
So do we have any idea if the income tax paid in other countries will scale larger as the overall company grows? Or are those income taxes for subsidiaries that aren’t growing in the same manner as the overall parent company is?
EVNow
Well-Known Member
They will be paying more income tax as GF3 and GF4 comes online and they sell more overseas.So do we have any idea if the income tax paid in other countries will scale larger as the overall company grows? Or are those income taxes for subsidiaries that aren’t growing in the same manner as the overall parent company is?
I updated my Q4'19 model a little bit:
Energy:

Automotive


Income

Cash Flows


- I lowered credits by $50M, because I feel like they'll push some to Q1'20 to help with S&P 500 inclusion, if they have this flexibility.
- I removed restructuring and other OPEX expenses, because after digging through some SEC filings, the types of expenses that have been counted here in the past (lay-offs, store closing, energy division restructuring, office closing, legal fees vs SEC in 2018, etc.) don't sound like costs they have incurred in Q4'19.
- Made some other tiny adjustments here and there.
- Automotive Revenue = $6.21B
- Automotive Sales Gross Margin Excluding Credits = 20.6%
- Automotive Sales Gross Margin Including Credits = 22.0%
- Total Revenue = $7.22B
- Gross Profit = $1.43B
- EBIT = $467M
- GAAP EPS = $1.39
- Non-GAAP EPS = $2.47
- Free Cash Flow = $787M
Energy:
Automotive
Income
Cash Flows
ReflexFunds
Active Member
4Q19 Earnings and Cash Flow Model:
I'm posting here given its a weekend, but if you have comments on the model please reply in the Earnings Projections Thread: Near-future quarterly financial projections
Q419 Earnings Estimates:
P&L
Revenue $7,325m (+$1,022m QoQ, +$100m YoY):

Gross Profit $1,430m
Opex $970m
Net Income $269m (+$58m YoY, +$118m QoQ)
GAAP diluted EPS $1.5, Non GAAP EPS $2.6:
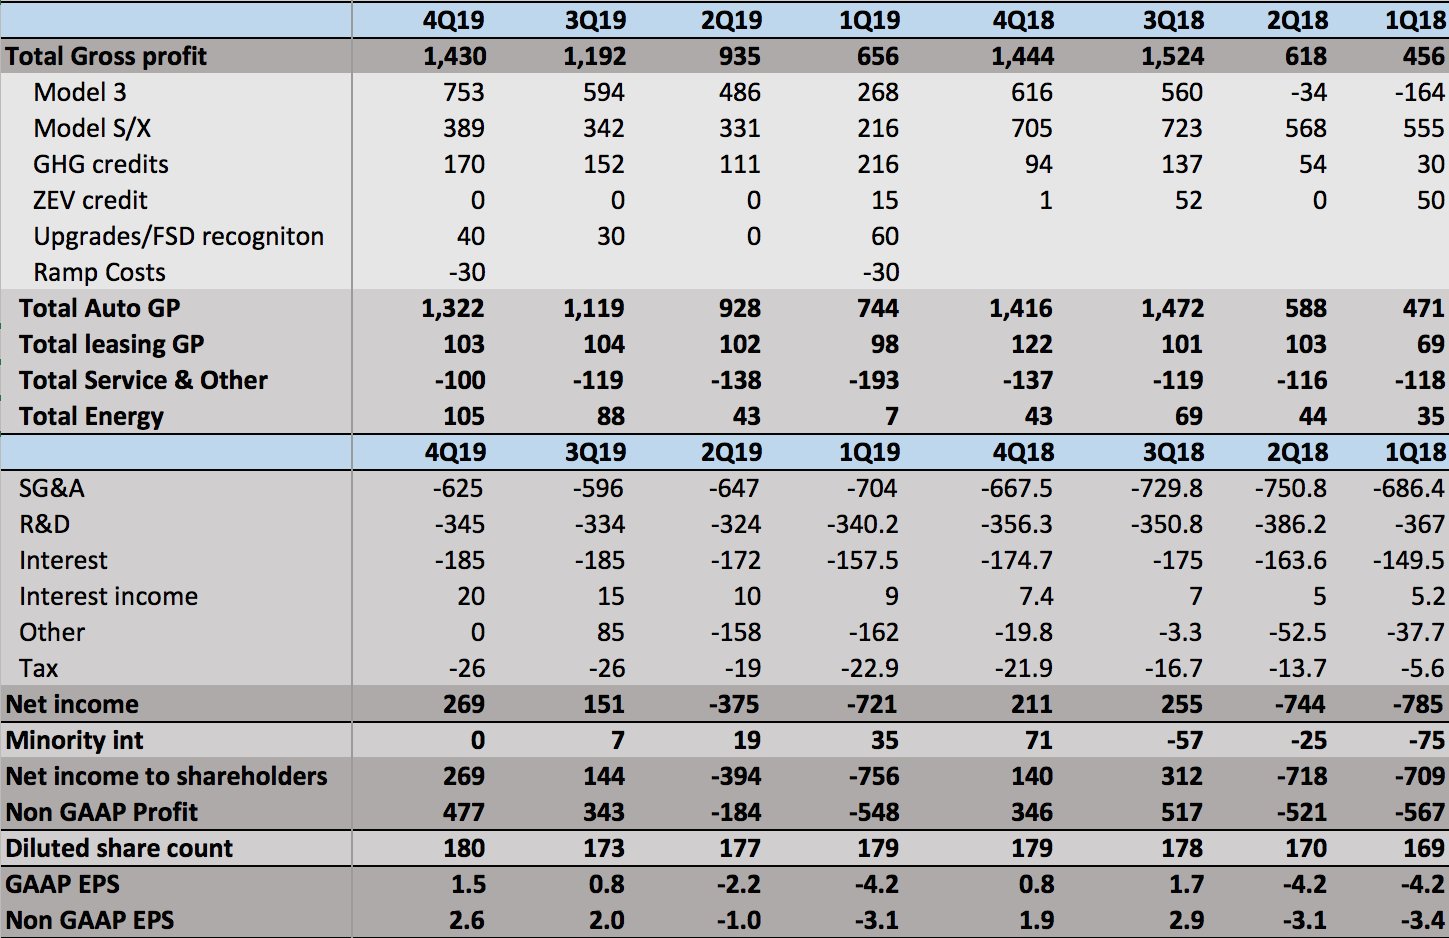
Key Revenue & Margin Assumptions:

In this model I have kept Model 3 gross margins flat QoQ. This excludes credit revenue, one off software upgrades (Acceleration boost), deferred FSD recognition and China one off ramp costs which have all been broken out separately.
I think flat margin QoQ is likely conservative - Tesla has consistently reduced production costs QoQ & > production drives > margins (fixed cost leverage, < staff hours/car, supplier scale saving passed on). Main risks are larger one off GF3 headwind & more +ve one offs in Q
Cash Flow
Operating Cash Flow: $1,476m ($1,031m before Working Capital)
Free Cash Flow: $976m
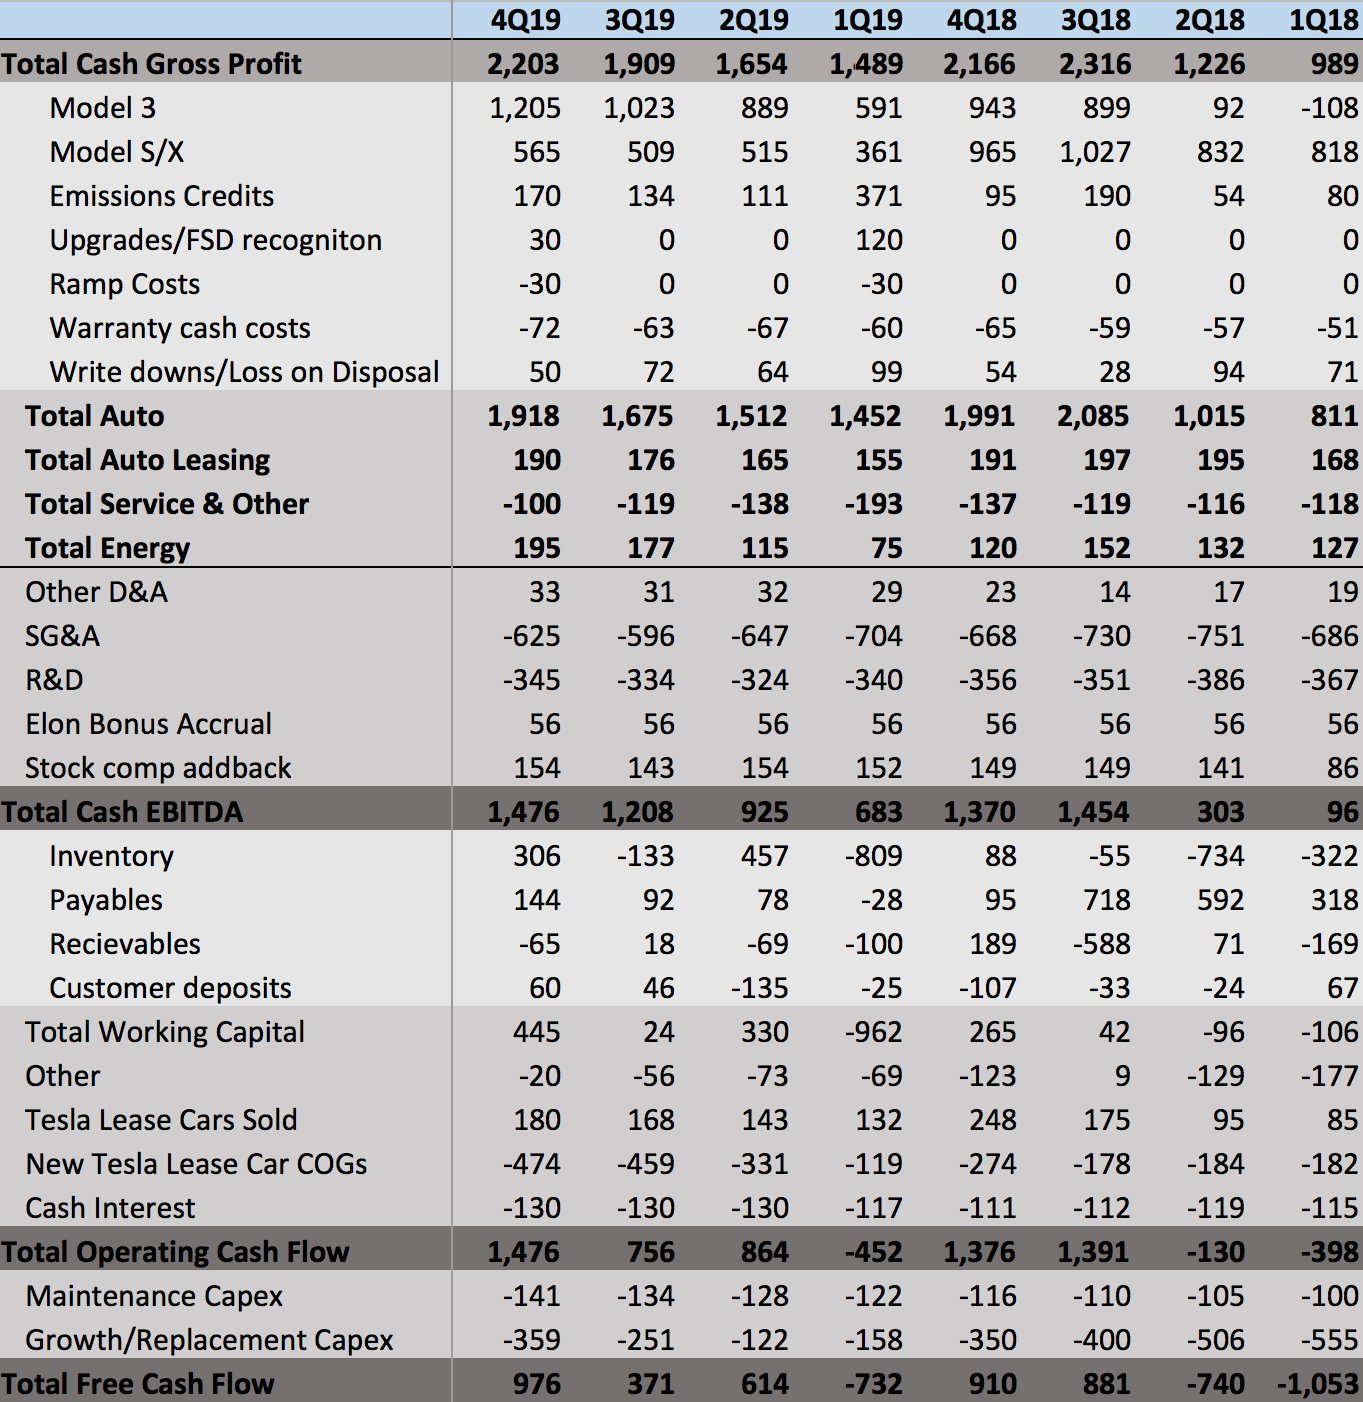
My cash flow statements use different presentation & include many estimates for past Q line items but Operating Cash Flow & Free Cash Flow for Q4 uses Tesla definition.
My Cash Gross Profit Line = Gross Profit plus non cash cost addbacks for Depreciation, Warranty Reserve and Net Deferred Revenue
Net debt down $871m QoQ to $6,266m.
Net debt/EBITDA down to 2.6x from 4.4x at 4Q18.
Net recourse debt down more than half YoY to $1,765m from $3,702m at 4Q18. This includes $4,200m converts which are all in the money (but not convertible until 3 months before maturity).
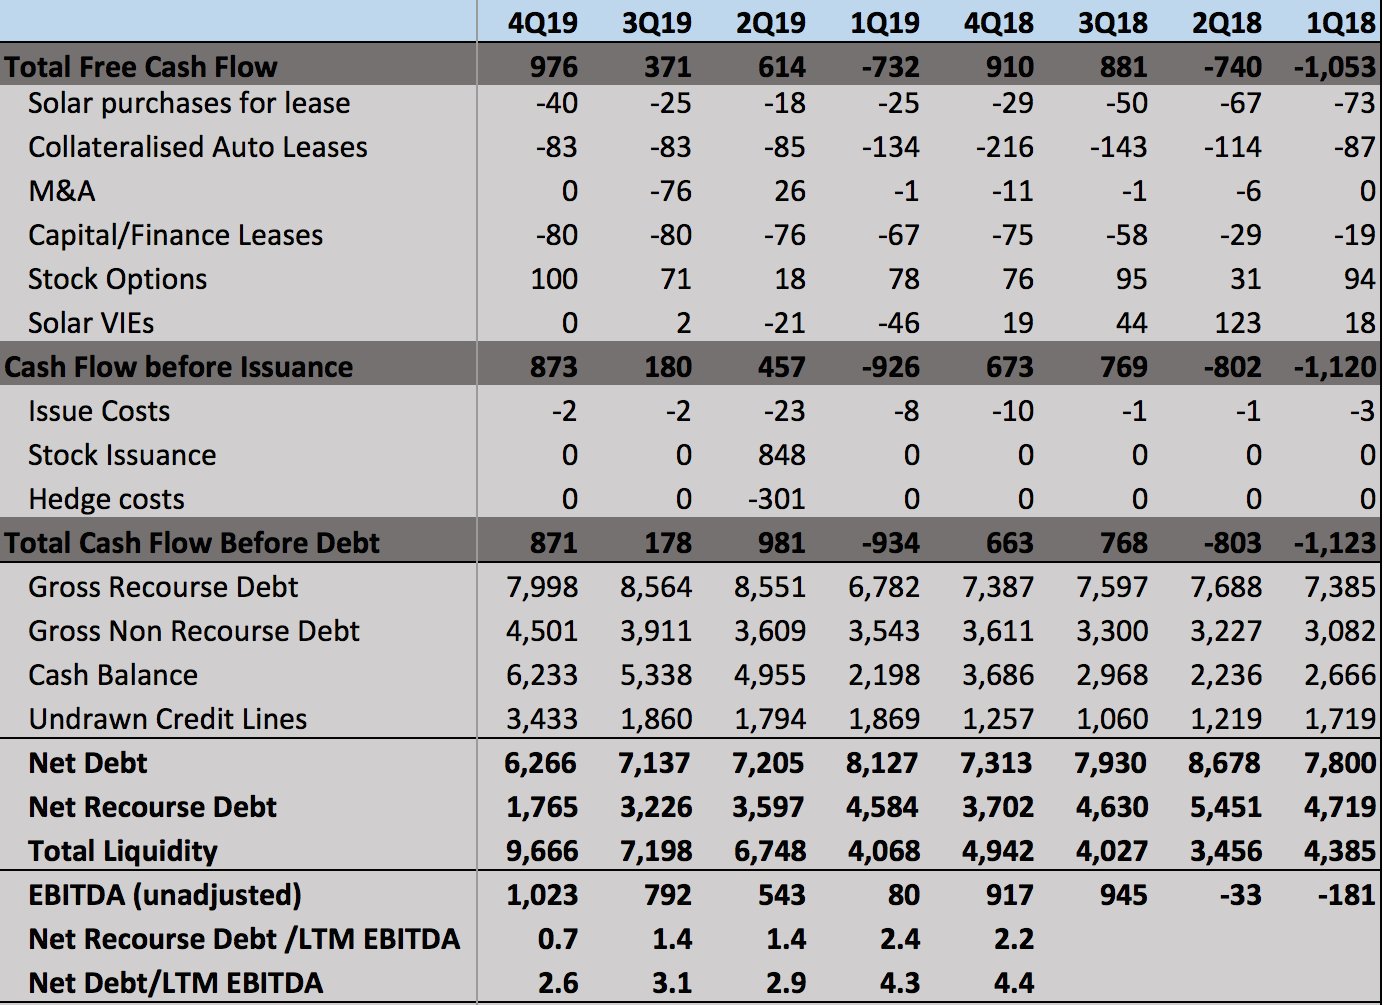
Q4 Total Liquidity: $9,666m.
Including $6,233m unrestricted cash and $3,433m undrawn bank lines.
I would expect to see credit rating upgrades after Q4.
Artful Dodger
"Neko no me"
This year the federal tax credit step-down is $1,875, so Tesla could already have dropped the price by $1,000 or even $500 if they wanted to - but they didn't so far.
Tesla doesn't plan to resume large volume deliveries in the US until the end of Q1 (likely March). In 2018Q4, we saw approx. 2 mths 'pull-fwd' of demand from 2019Q1, and a recovery to 'nominal' demand levels by March.
Its very possible that Tesla has calculated that US sales won't suffer at all by March, and the ROW will absorb production fully in Jan/Feb. With anecdotal evidence from S. Korea and rejuvenated tax policies in the UK and Germany, Tesla likely continues to remain Production limited throughout 2020Q1.
Then in 2020Q2, and throughout 2020H2, the continued rampup of GF3 MIC Models 3 and MIF* Models Y will unlease a massive wave of pent-up demand, which Tesla's soaring production rates will struggle mightily to satisfy.
Imma call it: 600K vehicles produced in 2020, for a >50% increase in production. It won't be enough.
Cheers!
*Made in Fremont
Last edited:
Artful Dodger
"Neko no me"
4Q19 Earnings and Cash Flow Model:
Tesla, TSLA & the Investment World: the 2019-2020 Investors' Roundtable
Thanks for this effort, ReflexFunds. True service to the community. Outstanding.
I notice one of your assumptions is an FSD take rate of 50%. I've seen other estimates of 25%. There's been an attempt to model FSD take by dividing deferred FSD revenue by the number of HW2+ units produced since Oct 2016.
Do you have a source estimating FSD take rate? This seems it would have an outsized effect on gross margin per unit.
Cheers!
Last edited:
EVNow
Well-Known Member
Here is my corrected model.
The correction is to bring the auto-margin forecast inline with the previous margin calculation. There was an error earlier where for past quarters I was calculating the margin including the regulatory credits, but the forecast excluded the credits. This inflated the profit.
On a big table like this, where does the money Tesla will probably receive from FCA come into this? I know it is hard to model, but what line does it end up on? How much is it for Q1-Q4 2020?Here is my corrected model.
The correction is to bring the auto-margin forecast inline with the previous margin calculation. There was an error earlier where for past quarters I was calculating the margin including the regulatory credits, but the forecast excluded the credits. This inflated the profit.
View attachment 499379
EVNow
Well-Known Member
Regulatory credits - line 18.On a big table like this, where does the money Tesla will probably receive from FCA come into this? I know it is hard to model, but what line does it end up on? How much is it for Q1-Q4 2020?
I've assumed the same credit in Q4 as in Q3, ~$135M.
FCA will start paying from Q1 '20 - where I've included $200M. We know the total value is some 2B Euro over 2 years. But we don't know whether it replaces what Tesla has been getting or whether it is in addition. Conservatively, I've assumed it replaces the credits Tesla has been getting.
ps : 1.8B Euros over 2 years. We don't know how it is structured - it could be based on # of cars sold by Tesla in EU. Also, the reports said Tesla will account for 80% of credits in 2020 and only 15% of credits in 2021. So, of those 1.8B Euro, a vast majority could be in 2020, which could mean closer to $350M in credits per quarter, rather than $200M.
BTW, all this assumes FCA can greatly reduce their emissions in 2021, which I doubt. So, FCA will probably have to pay a lot more than $1.8B to Tesla over 2 years.
Last edited:
EVNow
Well-Known Member
Are your ASPs including regulatory credits ?4Q19 Earnings and Cash Flow Model:
JohnnyEnglish
Member
Here is my corrected model.
The correction is to bring the auto-margin forecast inline with the previous margin calculation. There was an error earlier where for past quarters I was calculating the margin including the regulatory credits, but the forecast excluded the credits. This inflated the profit.
View attachment 499379
I think the ASP for all models will rise after the release of FSD
ReflexFunds
Active Member
Are your ASPs including regulatory credits ?
ASPs are real ASPs payed by the customer - so excluding credits, including 100% of FSD cost and subtracting no deferred revenue.
The revenue line items in the P&L use further adjustments to the ASP to account for the deferred revenue/FSD etc.
Similar threads
- Replies
- 192
- Views
- 20K
- Replies
- 41
- Views
- 7K