If you want numbers, there is a reasonable selection of monthly generation figures here
Electricity Generation/Consumption Data Logs Also, worth a look at
PV Ladder which will hopefully default you to UK systems where you can then start looking for more relevant sites to you.
We have a 4kWp install, we average 8-9kWh daily across the year (see below). PV systems, like batteries, will degrade, get dirty (doesn't make a huge difference) and (inverters) fail over time.
Our winter output is dire, we have a nice woody area of trees at bottom of garden, we also drop off earlier in the evening, as we are on a hill, so get a bit of late afternoon shading from the west. We are probably annual 10-15% efficiency down on what a peak system would do, but that seasonal, so winter 100% down (f-all of f-all is still f-all), high summer not too much. Worth pointing out, this April is exceptional PV wise and may go on to beat our all time April generation record.
View attachment 535381
View attachment 535375
Install wise, FiT scheme no longer plays a major part as it once did, but when it did, an average domestic PV install use to top out at 4kWp (there was a hard financial cutoff at 4kW) - typically 16 panels if you go counting panels on roofs - often 2 strings of 8 panels (the bit about split orientation I mentioned). Now FiT plays negligible part, the 4kW bit is no longer so critical, but the 16A export limit is. To exceed that, you need DNO permission and its by far a foregone conclusion that you will get it granted on single phase without very expensive kit to limit. The much cheaper solution seems to be sticking with a 16A inverter, but slightly overcooking the PV - maybe 5kW or a bit more. That flattens the curve and provides a small (20% or so) power benefit outside the peak window.
Putting
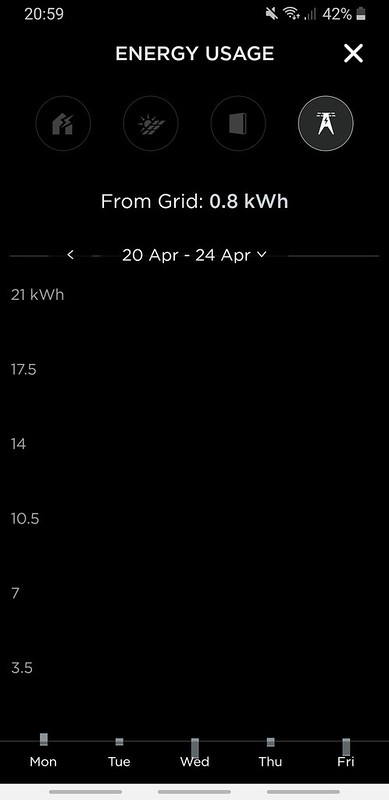
@Dilly system into perspective, its 3 x a typical size that most mere mortals achieve. There are different rules for systems that size that simply do not work for smaller systems. Lets play fit a 10A charge under a (normally) rare generation curve. This one was 9% in 3 hours. Obviously a Powerwall will give a potential longer period, but so will a much smaller capacity battery. Again, worth reiterating, this April is exceptional, near perfect insolation curves such as this are a rarity over the course of a year. Don't go buying PV if you think performance like this is typical, it is not.
View attachment 535383
Finally! This graph below shows the potential for storing and using excess/exported energy. The numbers equate to around £250/year at 13.8p/unit or £100/year at 5p/unit. If you could store every one of these kWh, which due to storage and usage limits you will not be able to, this represents the maximum saving that can be made by storing free PV energy. On top of that, saving can be made at less sunny times, you can make additional savings by time shifting, say saving 9p/unit, but I'm yet to see that being any more significant when a significant amount of charge time can be achieved at 5p/unit without doing anything other than scheduling a charge. If you look at the battery at having a 10 year lifespan, hopefully a bit more, the numbers really do fall short on a typical Powerwall install. Something that some less scrupulous installers will mention.
View attachment 535385
PV and batteries is a seriously large rabbit hole. Once you go down, you may not return for a very long time.