Artful Dodger
"Neko no me"
SN10 abort on Raptor shutdown at T-0 sec.SN10 is getting ready for launch


You can install our site as a web app on your iOS device by utilizing the Add to Home Screen feature in Safari. Please see this thread for more details on this.
Note: This feature may not be available in some browsers.
SN10 abort on Raptor shutdown at T-0 sec.SN10 is getting ready for launch
Got some at 662, my next order is at 652. Edit: this hit as well. FYI, I thought about buying back some calls and watched the price go up while the SP went down, so IV must be rising(or maybe people are buying these on the dip, expecting a rise by Friday).In for some more at $659.
Anyone seeing any interesting opportunities on Calls / LEAPS / Selling Puts ?
I might live to regret it... Bought 100 shares with my Model Y money at 657.
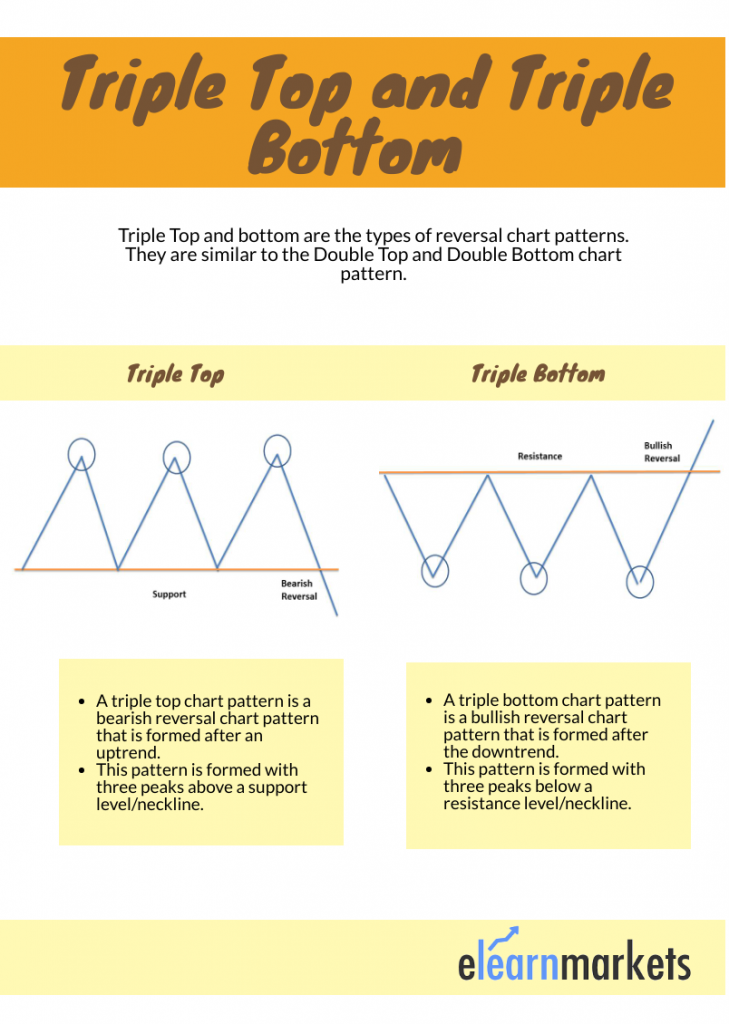
What is a triple bottom?Triple bottom. Up from here...

What is a triple bottom?
On another note, I’m feeling so happy I took advantage of all these OT shifts at my two jobs these last 6 months!!!! I’m emptying out my savings accounts now
I am expecting turbulence and downdrafts until mid-April. I set a buy order for a few more shares (at a low limit) at the end of last week. Holding tight, as always...
Get in line......im interviewing in 5 minCan anyone point me to that Wendy's application that was discussed a couple of days ago? Seems I might need that 2nd job afterall
Got some at 662, my next order is at 652. Might hit as well. Edit: This sure looks like some major capitulation. Briefly broke 700 this AM, then tested 695 (S&P inclusion SP) and fell back from that point. I’m no expert, especially in technical analysis, but that retest/failure at 695 seems pretty important. Anybody else got ideas or what the next support level might be?
How come they didn't halt the stock already???
Can anyone point me to that Wendy's application that was discussed a couple of days ago? Seems I might need that 2nd job afterall