You can install our site as a web app on your iOS device by utilizing the Add to Home Screen feature in Safari. Please see this thread for more details on this.
Note: This feature may not be available in some browsers.
All the statistics I've seen, and the majority of the anecdotal evidence, suggests that PHEV are seldom plugged in. Clearly there are some exceptions, but personally I think it is overdue to stop giving the benefit of the doubt. Many governments have come to the same conclusion and tapered/ended PHEV benefits and focussed them to BEVs.
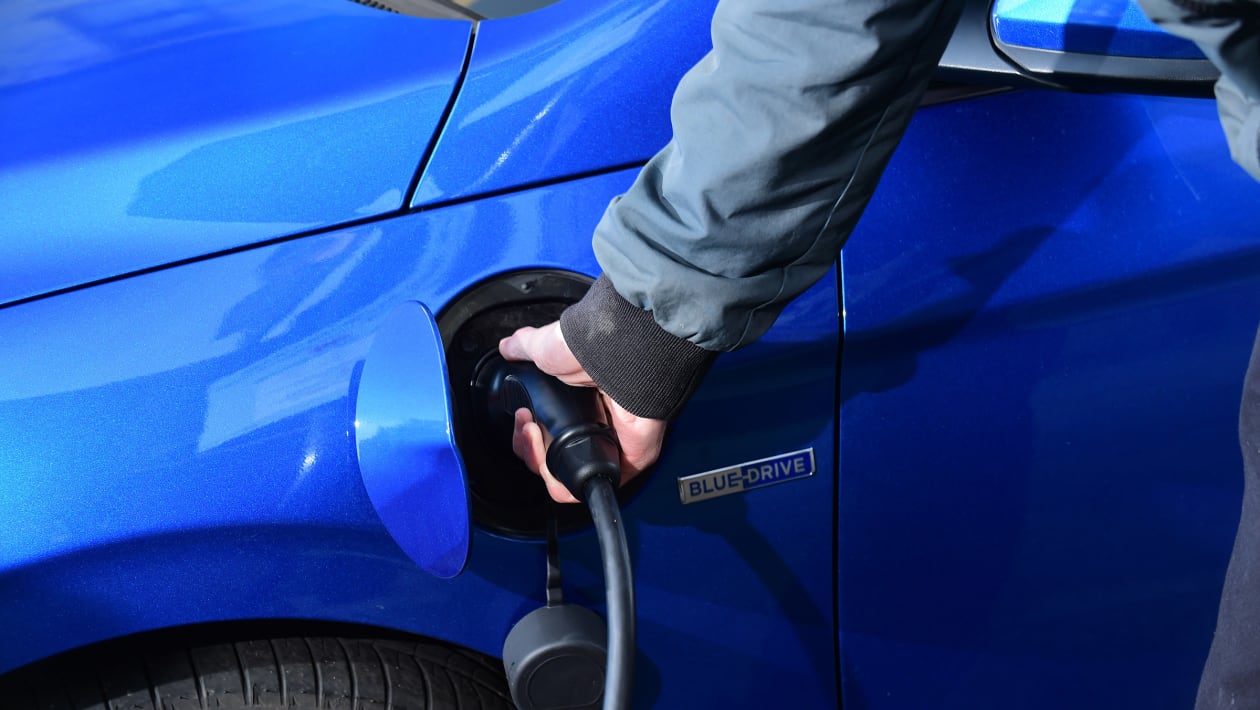
Plug-in hybrid electric vehicles (PHEVs) are only effective if you keep them charged. Otherwise, they're just a gas-powered hybrid with harmful emissions.
Early plug-in hybrid adopters likely have more access to charging, while mainstream adopters can't be assumed to plug in as often, the study concluded.
Inner city to city? 100% trains. I haven't needed a car in 15+ years, and wouldn't trade my bikes/trains for a car even if it had FSD v44.5.
Every time I accept a ride with friends (to make them happy), I end up losing my time in traffic. PS: I know its a privilege (I live in Paris, France) but it's a way of life too and wouldn't be that difficult to rebuild countries designed for people (instead of cars)
You missed the point. When you take a robotaxi by yourself, your time is your own to use as you choose. This differs from having to spend your time chatting with friends, with whom you apparently don't want to be.
It doesn't matter. The stats show that "most people don't plug in" PHEV is not true.
Even the misreported ICCT report doesn't say that most people don't plug in, it says of electric miles that "Specifically, the analysis finds that real-world electric drive share may be 26%–56% lower ... than assumed within EPA’s labeling program for light duty vehicles."
How people jump from 26%-56% lower to "most people don't plug in" is just by making *sugar* up.
The last time he provided links I checked them. None of them corroborated his claims. It's a meaningless argument and a waste of time even for a weekend topic. Hopefully the mods help to end this trolling...
So in the past we have discussed the JPR007 valley of death graphic.
we've covered multiple issues with it. My first step at improving it was to fact check the historical data. I found widely varying numbers (and could find some that matched) but settled on using Cars from 2022 statistics | www.oica.net and prior years
The peak is in the same year (2017) but the scale is smaller because I excluded commercial vehicles. I'm not sure what OICA considers a commercial vehicle so that might have to be revisited.
I didn't bother fact checking the EV production numbers. I might revisit that also.
This is a first attempt at a new "valley of death" chart based on the OICA numbers. I've got what are likely very poor guesses for 2023 to 2030. I kept the 2025 as the low production year like JPR007 had it and just fudged the numbers until the curve looked interesting.
But if you would like to critique, I'll make it prettier once we settle on content.
A counter-example: my neighbour has a hybrid Porsche, and I’ve only seen it charging when it was brand new because he was trying out his charger. That’s a couple of years ago.
Conclusion: we need statistics, not anecdotes.
we've covered multiple issues with it. My first step at improving it was to fact check the historical data. I found widely varying numbers (and could find some that matched) but settled on using Cars from 2022 statistics | www.oica.net and prior years
The peak is in the same year (2017) but the scale is smaller because I excluded commercial vehicles. I'm not sure what OICA considers a commercial vehicle so that might have to be revisited.
I didn't bother fact checking the EV production numbers. I might revisit that also.
This is a first attempt at a new "valley of death" chart based on the OICA numbers. I've got what are likely very poor guesses for 2023 to 2030. I kept the 2025 as the low production year like JPR007 had it and just fudged the numbers until the curve looked interesting.
But if you would like to critique, I'll make it prettier once we settle on content.
I'm beginning to see why the UAW is in an uproar with GM, Ford, and Stellantis.
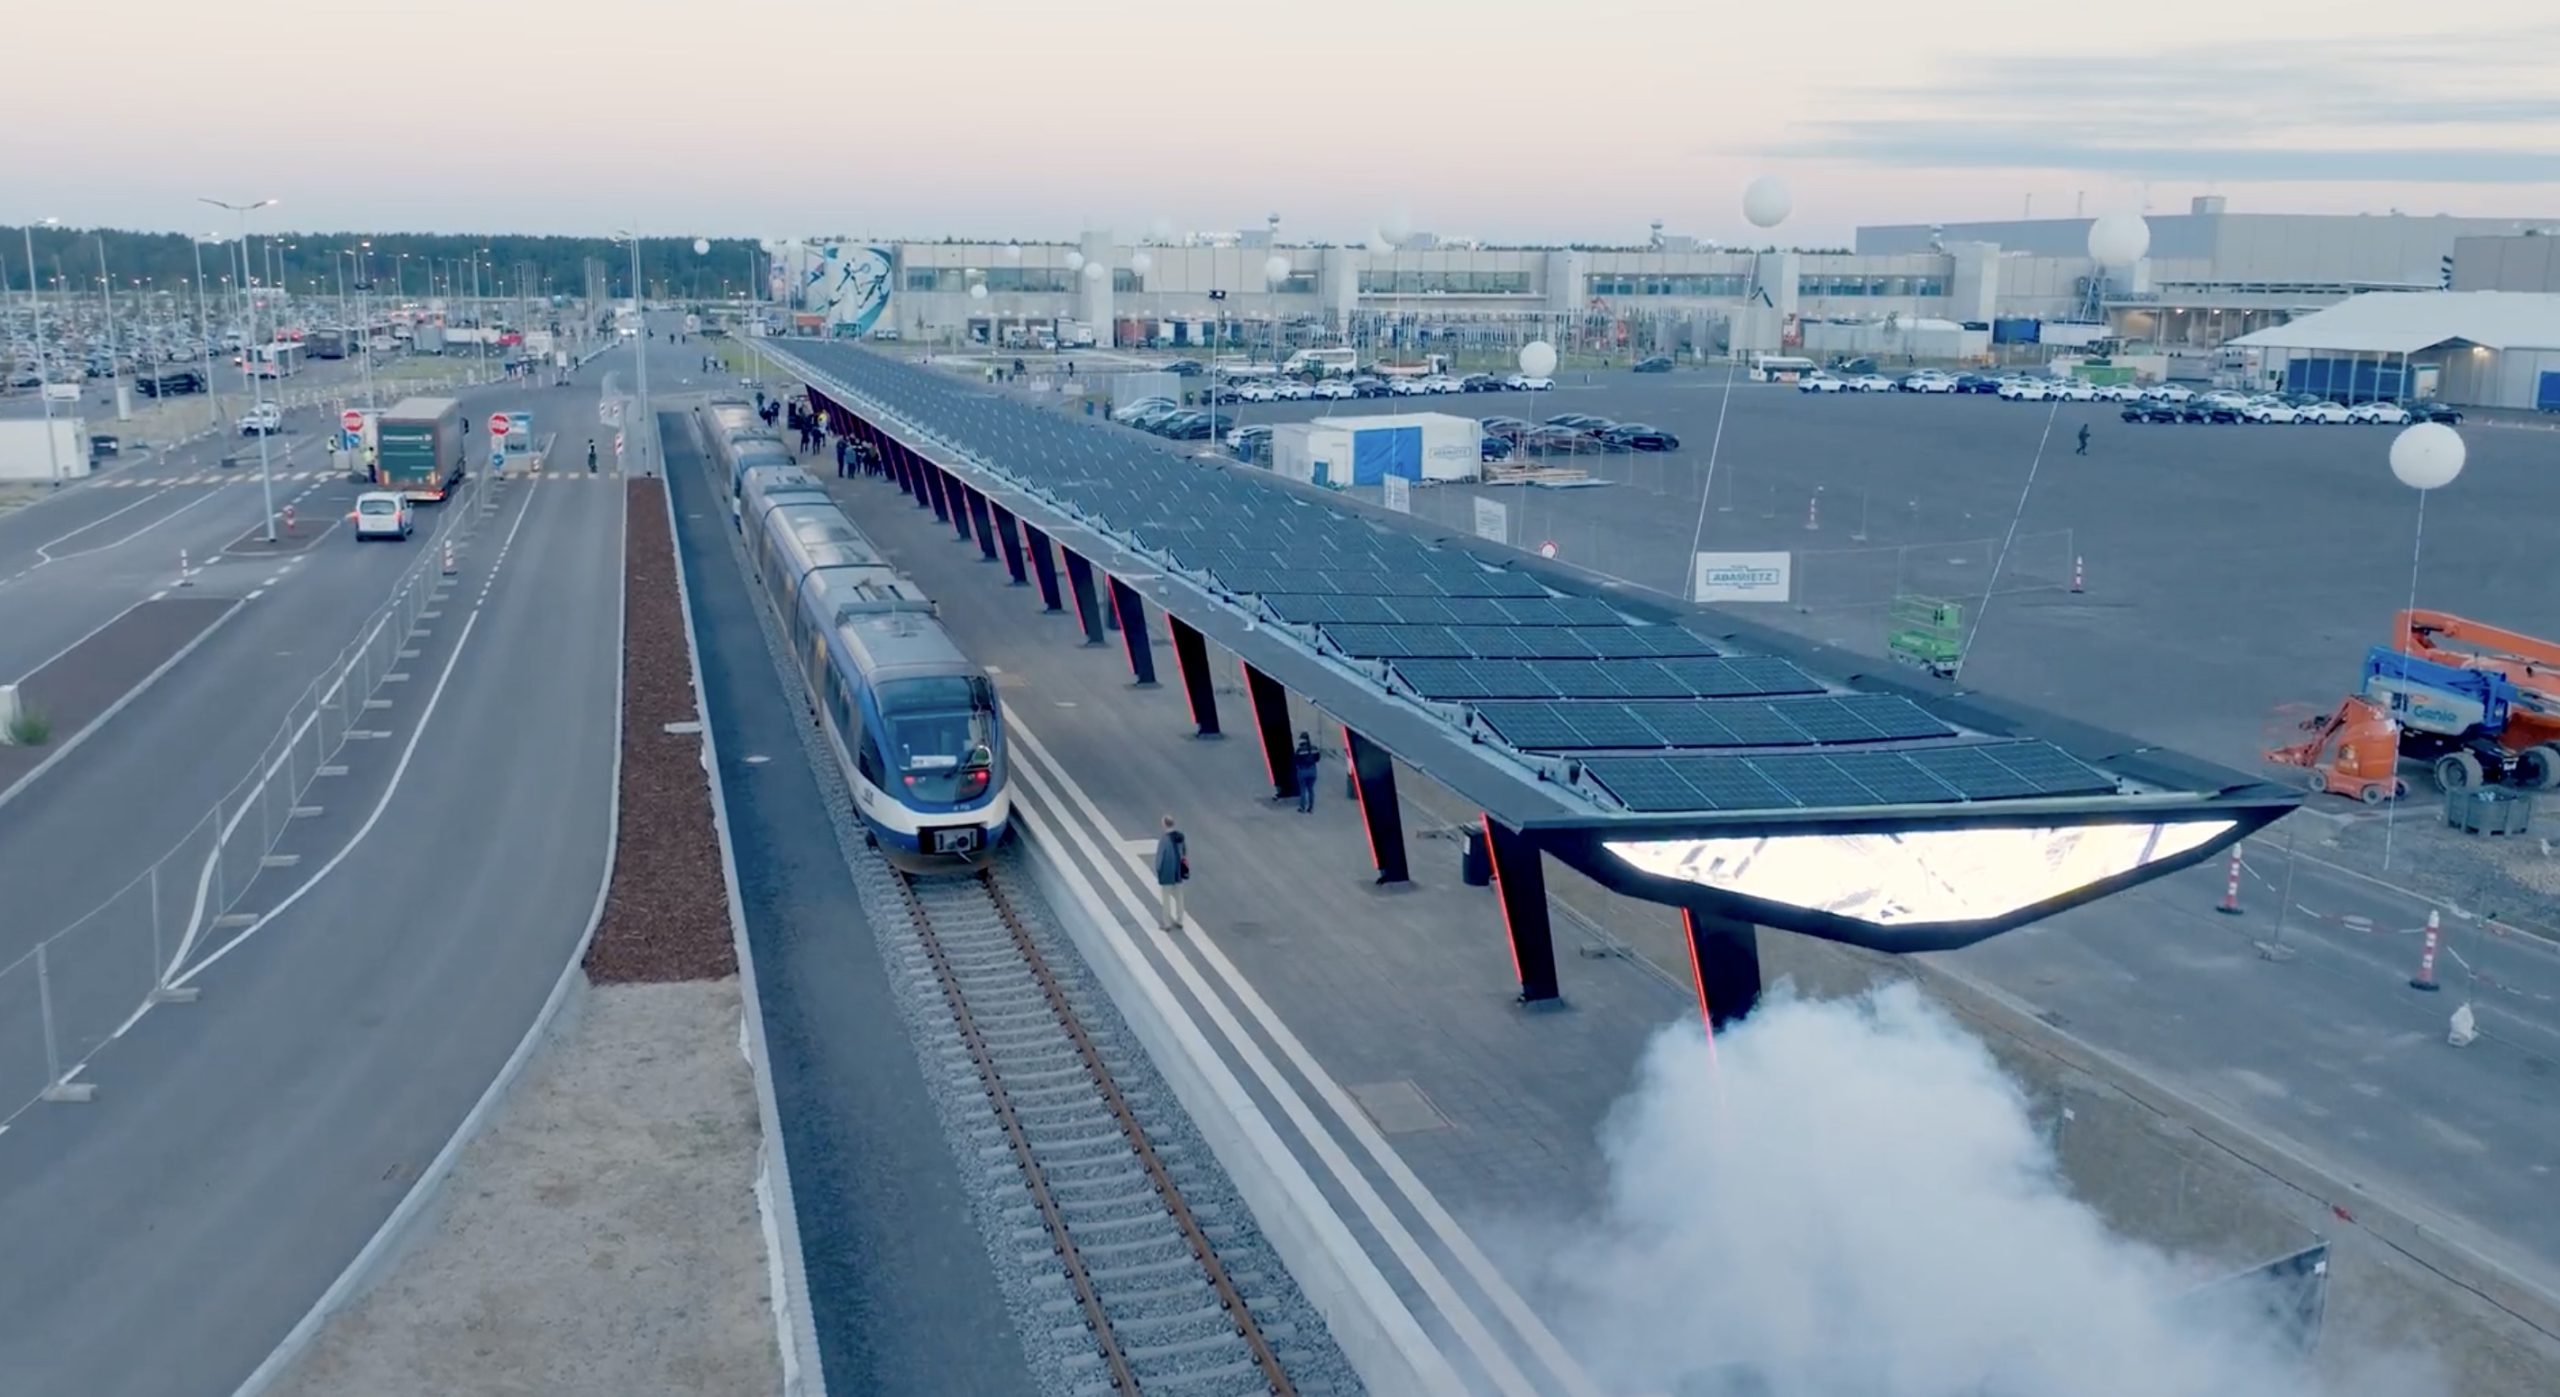
Do those OEMs provide free train service for employees to get to work like Tesla does?
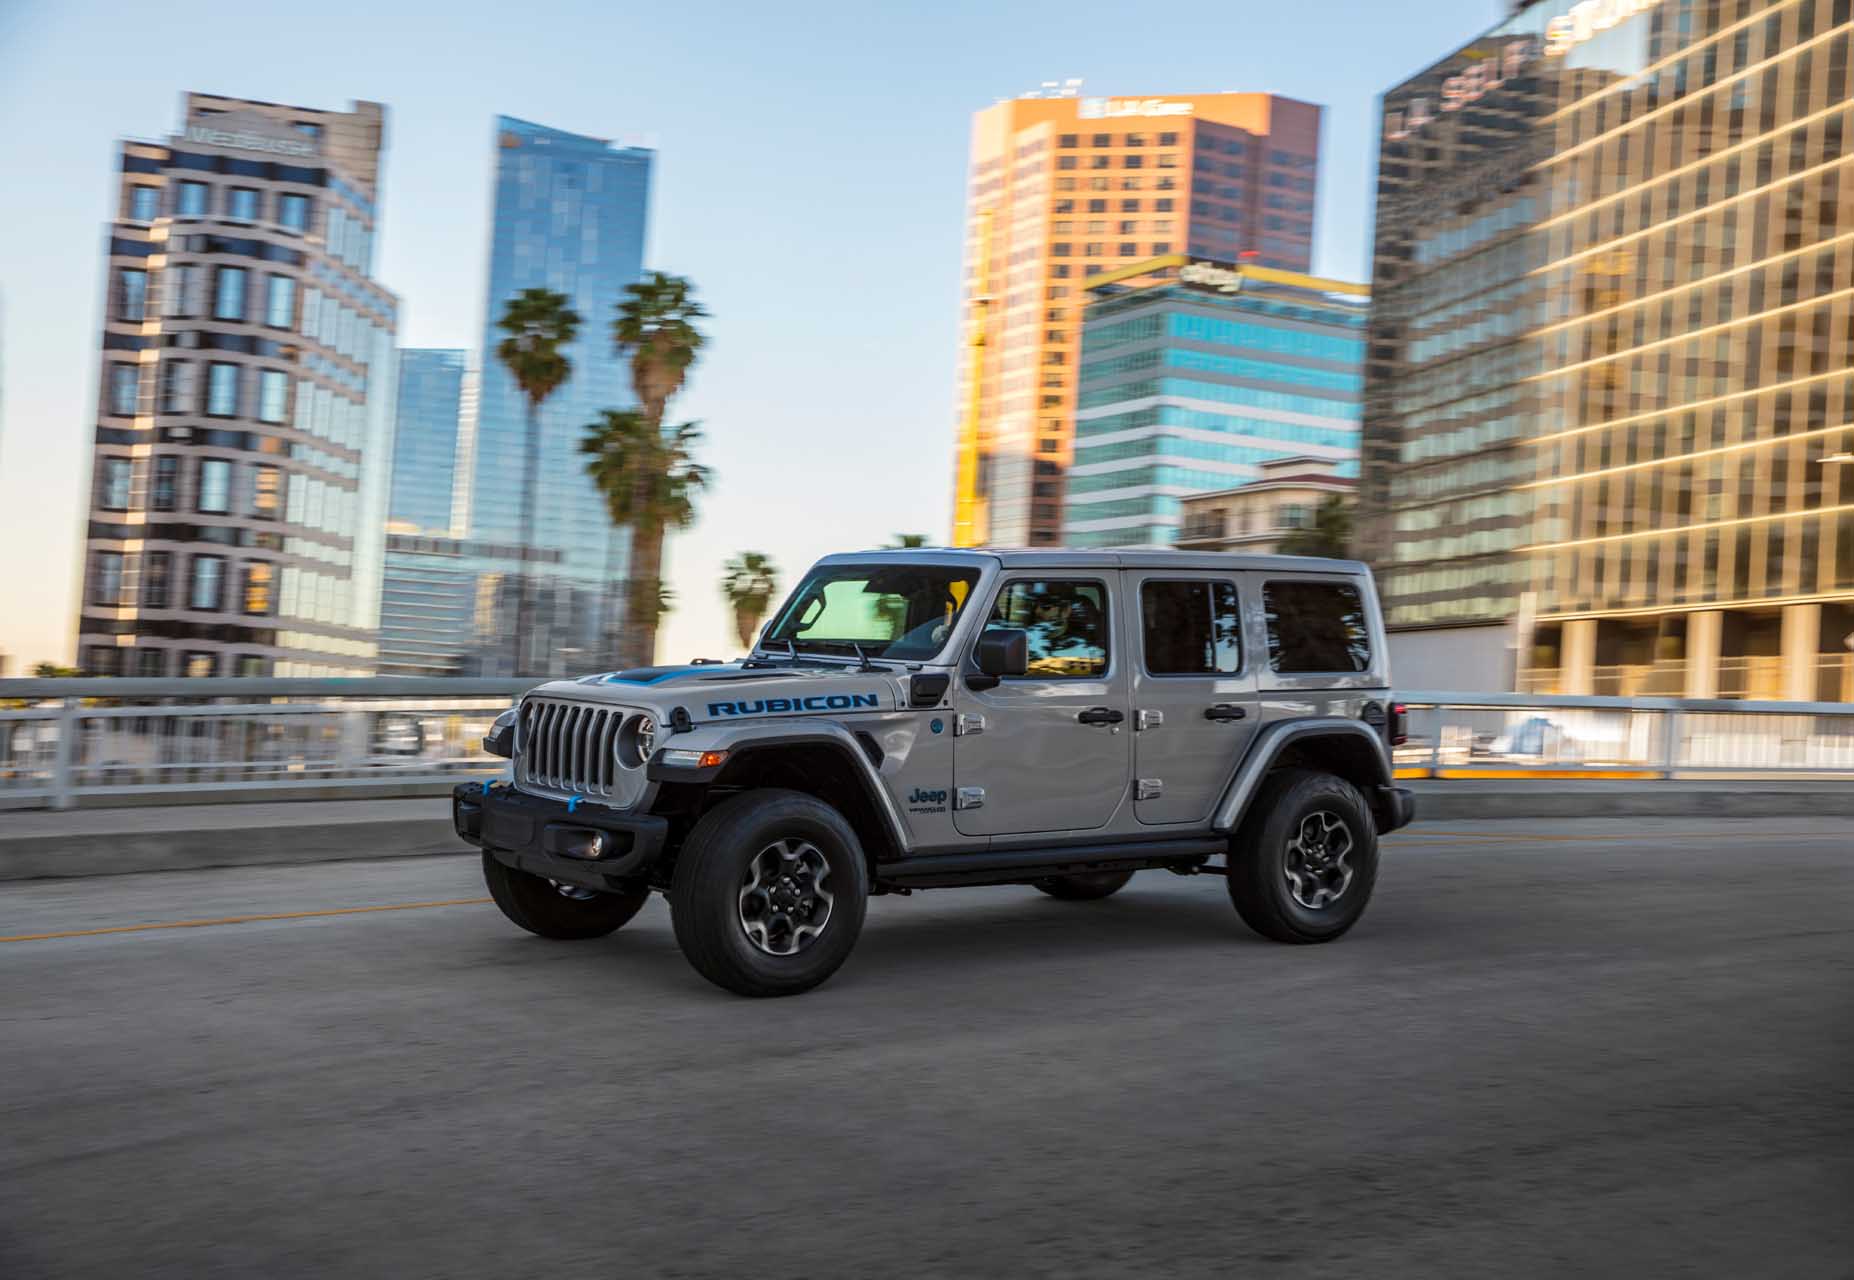
It feels like a lot of phev owners don't bother getting 240v/L2 installed, but rather content themselves with whatever they can get with provided adapter. My neighbor has a jeep occasionally plugged into the porch outlet so that's probably what they all do.