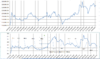
Welcome to Tesla Motors Club
Discuss Tesla's Model S, Model 3, Model X, Model Y, Cybertruck, Roadster and More.
Register

TSLA Technical Analysis

This site may earn commission on affiliate links.
That recent divergence is quite interesting. I'm wondering if the manipulation can keep the lid on the price for that long despite accumulation of the stock. Possibly something to do with the convertibles? There has been minimal dilution over the last year, so that shouldn't be a factor. How does shorting affect accumulation? Similar to dilution I'm guessing?
EEEKK! I forgot!!!
CLV = (((close-low)-(high-close))/(high-low) TIMES daily volume, then running total
 
$360 is probably the line in the sand
Watch for either topping candles right around there especially if there is slow gradual rise in SP
OTOH if SP explosively crosses $360 then $390 to $400 is in sights
I’m less inclined to overstay my welcome over $390 to $400 but all totally depends on the quality of the next up move
BTW weekly and Monthly AD lines are trending down for what it’s worth (not much because it is neither here nor there)
Last 2 major moves been for $100 each
Shoot for $397 next time?
% wise 35 to 36% off last lows entirely reasonable
Gets me $400
That would be a formidable psychological barrier
If we blow through that then all bets are off
I’m cautiously optimistic plus incredulously skeptical
Shorts are a mischievous bunch
Totally agree that $360 is a clear line in the sand until there is overwhelming volume to drive through it. I think after this last big drop from near the ATH, there will be a LOT of selling once the SP gets around that level again. It will obviously punch through $390 eventually, but it may take a few tries yet.
 
  • Like
Reactions: TrendTrader007
added roughly short interest for last 5 months
Note
5/22 to 6/2
6/2 to ~7/3
divergence 7/3 to 8/31
not sure about, if any correlation with short interest, other than 17% decline since 5/31
upload_2018-9-2_12-16-18.png
 

Attachments

  • upload_2018-9-2_12-15-32.png
    upload_2018-9-2_12-15-32.png
    143.2 KB · Views: 62
Last 12 months on weekly shows decline in accumulation similar to stock price.

View attachment 331301
we have a slightly different A/D line.
Yours looks closer to "on Balance volume" OBV, bit a teensy bit differant
I'm using a summation, starting at 6/29/2010, not as an oscillator
If I set as 0, 9/5/2017 the summation starts drifting upwards beginning April this year
perhaps I have a different definition of Accum/Distrib line, and am using a bit incorrectly,
however, Schwab and I seem to agree on at least the shapes of the graphs
either way, something very whacky is going on, and 5% of my investments say upwards, since beginning of April, and accelerating since mid July if you do a 20 day smoothing of the A/D line
At any rate, this week will be "stomach churning" for some, hopefully those short in some fashion
From my excel files
upload_2018-9-2_17-47-22.png


from Charles Schwab

upload_2018-9-2_17-50-55.png
 
Last edited:
  • Love
Reactions: TrendTrader007
Accum/Dist vs OBV
it's been awhile since I read "Technical Analysis of stocks and commodities" but it was mostly like trying to "scry the entrails of sheep" for hints of the future, so i gave up after losing a lot of money,eh, perhaps this time
A/D gives greater weight to both high, low, close times volume
Accumulation/distribution index - Wikipedia
OBV just weighs volume
On-balance volume - Wikipedia
upload_2018-9-2_18-21-17.png
 
Last edited:
  • Informative
Reactions: TrendTrader007
Exactly. so basically in a sideways trend for now with an upward bias
it will take time for weekly moving averages to straighten up
i certainly hope that we start September positive first week and then see what happens over the next few weeks
Since you've gotten more cautious, we may be close to the depth of despair, and ready to turn a corner?
No offence, you've always shown such unrelenting optimism, it's surprising to see your cautious tone in last few posts.
 
  • Like
Reactions: AlMc and neroden
Do yourself a favor, cover before market close on Wed, lock in the profit. This downward price movement is telling me any negatives from q2 will be priced in at this point. *not an advice*

So I initiated a short before earnings and certainly didn't see the response that would ensue after another bad quarter. Whats worse is I added again at higher levels only about an hour before funding secured. After observing the same pattern close to the ATH as before ( distribution per the usual), I initiated new jan 2020 puts.

equity position was closed out early for a quick couple weeks @ 10%. The puts are up 60% for < 4 weeks of work.

Point is, glad I didn't cover. And given the bad news, I don't plan to cover today either. Holding this thing is pure insanity over the weekend given the current bad news flow from the company.
 
Since you've gotten more cautious, we may be close to the depth of despair, and ready to turn a corner?
No offence, you've always shown such unrelenting optimism, it's surprising to see your cautious tone in last few posts.
I think we should all be extremely negative, but not give any (and buy if you have the cash) shares. At least, then the only real surprise will be positive.