Welcome to Tesla Motors Club
Discuss Tesla's Model S, Model 3, Model X, Model Y, Cybertruck, Roadster and More.
Register

Battery health tracking SS

This site may earn commission on affiliate links.
Which means 71kWh battery remaining. So is that 95% of 75kWh usable battery?
The method provides the full battery capacity including the buffer as indicated in the link.

The Model Y 2020 started between 78kWh and 79kWh (can look at the EPA docs), has a “full pack when new” of 77.8kWh (nameplate rating).

71kWh is slightly lower than my 72kWh guess. You’re at ~287-290 at 100%, not the 300 you claimed earlier. Note @AAKEE spreadsheet predicted 69.6Wh assuming 77.8kWh, so if you started at closer to 79kWh (quite possible/likely), you’d be at about 70.8kWh.

Anyway about 9-10% loss, nearly exactly as expected and predicted by the spreadsheet.

I’m at the same level (71kWh) with a six-year-old pack (same pack) where I did the same thing for the first three years before @AAKEE convinced me I was doing it wrong. Has basically stopped losing capacity since I adjusted strategy.

How do you account for that? Pretty large margin of error considering its degradation of single percentages per year. Especially longer into car's life.
These questions are addressed in the link. The answer is basically two sig digits unless you go to 100%. It doesn’t matter much. Within 1% is fine.

What I am saying is that calendar aging is not the only thing that degrades our car batteries.
No but it dominates in most use cases so it doesn’t matter.
 
Last edited:
  • Like
Reactions: AAKEE
The method provides the full battery capacity including the buffer as indicated in the link.

The Model Y 2020 started between 78kWh and 79kWh (can look at the EPA docs), has a “full pack when new” of 77.8kWh (nameplate rating).

71kWh is slightly lower than my 72kWh guess. You’re at ~287-290 at 100%, not the 300 you claimed earlier. Note @AAKEE spreadsheet predicted 69.6Wh assuming 77.8kWh, so if you started at closer to 79kWh (quite possible/likely), you’d be at about 70.8kWh.

Anyway about 9-10% loss, nearly exactly as expected and predicted by the spreadsheet.

I’m at the same level (71kWh) with a six-year-old pack (same pack) where I did the same thing for the first three years before @AAKEE convinced me I was doing it wrong. Has basically stopped losing capacity since I adjusted strategy.


These questions are addressed in the link. The answer is basically two sig digits unless you go to 100%. It doesn’t matter much. Within 1% is fine.


No but it dominates in most use cases so it doesn’t matter.

I havent charged to 100% in about 4 months, at that time it was ~303miles I believe. But Ill check again when I charge to 100% next time. I would have definitely noticed if it was below 300 as its sort of a psychological treshold.

I looked at the link you provided but I fail to understand how it can account for the entire battery pack if estimated 0 range is hit before pack is fully used. So estimated range is only using usable capacity for its calculations? Why do we use capacity outside of the range screen calculations?

To maybe clarify what Im talking about. If you drive until 0%. Your estimated range will be 0 miles. So if you do the calculation it will say you are at 0 kWh. But in reality the pack has capacity leftover.

Also, for instance, if you have 1% left, your Wh/mi Avg will still be the same (because thats your usage, its same regardless of percentage of battery), so 248. At 1% the car will project something like 3 mile range. Do the calculation. You are now at 1% degradation.
 
Last edited:
For calendar aging? no other variables. What I am saying is that calendar aging is not the only thing that degrades our car batteries.
Nor the research or me only use calendar aging. Cyclic aging is tested as thouroghly as calendar aging.
This is actual model 3 (2018) cells, cycled in 10% steps. (As usual, the report specifies the exact conditions like temperature, charge current and discharge current etc)
IMG_5171.jpeg


Actual Model S cells, calendar and cyclic aging:
IMG_2969.jpeg


These where, from memory cycled with 1C both charge and discharge from 100% to 0% so the cyclic wear is much higher than for normal in car use.
IMG_2968.jpeg


We know that smaller cycles with lower amphs in general causes much less wear, from numerous different tests:
IMG_5338.jpeg


I have written hundreds posts with more detailed info and links to research reports.
I recommend to read one or a few.
This one is good (yes, it is written in English, skip the first three pages or so).
So you cant just look at calendar aging. If our cars were not driven and were just stored in a garage, then yes, aging would be the only thing that affects the batteries.
As already stated, its very well covered.
We also know that cycles for the normal used Tesla kan be disregarded in the calculation as it is only a small fraction of the total degradation the first 8-10 years.
- In your case you mostly have been around 70% with a Depth of discharge of not more than 10% ( as your miles split on 4 years / 365 days) tell us that.
Your 21K miles transfers to around 84 Full cycles(FCE). This is approx. 1% cyclic aging in the chart above testing actual model 3 cells.
From your about 9% loss, only about 1% comes from cycles.

Anyhow. Got 2 sets of stats for you. By the way.. question.. reading SoC as part of the equation, we dont get percent decimals, and in the next example if it ticks to 72% literally the second I put it in drive its several percentages different degradation than if its on the high end of 73% (just ticked down from 74%). How do you account for that? Pretty large margin of error considering its degradation of single percentages per year. Especially longer into car's life.

Another question. How do we know what battery capacity to use? For instance Model X Long Range Plus has 102 kWh battery, but the car will say it has 0% and 0 range left a while before using all of 102kWh, so the buffer is not used for range screen? Therefore should not be used in calculations?

Data 1:

Had a loaner earlier today, model X long range plus, it had charge set to 90%, had 46k miles on it (Made in May 2020). At 73% SoC it was Avg 361 Wh/mi and Projected 171 Mi.

Which based on that calculation means ~85kWh battery remaining (on 4 year old car with ~150? full battery cycles), but is that out of the usable (~95kWh) or out of the battery pack capacity?
Once again, only a picture of the energy screen can be considered valid data.

The data supplied is 84.56 kWh.
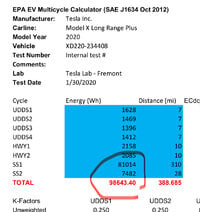
The 2020 X LR Plus delivered 98.6 kWh in the EPA test.

This is 14% loss.
IMG_9374.jpeg


Data 2:

My Model Y. SoC 75%, Wh/mi Avg 248, Projected miles 215. Which means 71kWh battery remaining. So is that 95% of 75kWh usable battery?
71kWh, out of at least 77.8 kWh.
At the EPA-test of the 2020 Y LR the battery delivered 78.3kWh.

So 8.7-9.2% depending from what starting point we use.
(I would prefer a picture of the screen like my example, to make sure my data is baed on facts without exemptions.
You can take a picture at any time. Driving etc doesn’t matter, it can be parked for long before also.)

As I’m sure the question will come ( :) )
-Yes, the energy graph use the complete pack including the buffer as it is possible to drive on it just like the EPA-test (which bases the range on all ”usable” energi (which actually means from full until the car stops.

(The cars are charged full and left overnight, so probably has used a little energy for balancing the pack).
IMG_9366.jpeg
 
Also, for instance, if you have 1% left, your Wh/mi Avg will still be the same (because thats your usage, its same regardless of percentage of battery), so 248. At 1% the car will project something like 3 mile range. Do the calculation. You are now at 99% capacity.

How the display works on a Tesla, for that question @AlanSubie4Life is your man.

I learned from him, but by using for example Scan my tesla and teslalogger I could confirm everything he stated to be exactly correct.

Tesla use 4.5% buffer on the LR/P’s

These are below 0% on the screen, butncannbe used to drive like a spare part of an ICE.

The EPA test means charging full leave over ight and then drive until it stops ( litterally stops).
This is the base for the EPA rating and tesla also use the full pack energy ti show the 100% range.
But during discharge a small part of the pack progressively is hidden by showing slightly less SOC on steen then the real SOC. For each 0.955% of the pack used the car shows 1% on the display.
 
Ok, there we go, thats the answers to the questions I was asking. Like I said, we kept misunderstanding each other, you kept talking about aging studies, while I was saying thats not the only variable in cars. Its good to see the data covering other aspects. Although I do still think that environmental variables have impact on car batteries (weather cycles, driving styles, charging speeds etc).... and cant be completely discounted. Stuff that lab cant replicate.

anyways. Here are the pictures of data I provided before (had to sensor the reflection/map).

Model_X_LR_Plus.jpg


energy_screen.jpg


also I did edit my previous post with more questions :) Battery health tracking SS while you were typing up your response.
 
Last edited:
I should also add, my Y was made in the first few months of production. I seem to remember that towards end of that first year (2020) there was an update that increased everyone's range by like 10 or 15 miles? That update did not increase my range. Not sure if that states anything about what battery pack my car came with.
 
Ok, there we go, thats the answers to the questions I was asking. Like I said, we kept misunderstanding each other, you kept talking about aging studies, while I was saying thats not the only variable in cars. Its good to see the data covering other aspects. Although I do still think that environmental variables have more impact on car batteries (weather cycles, driving styles, charging speeds etc)....

anyways. Here are the pictures of data I provided before (had to sensor the reflection/map).

View attachment 1060500

View attachment 1060499

also I did edit my previous post with more questions :) Battery health tracking SS while you were typing up your response.
Thank you very much. I appreciate getting “hard facts”. It helps with making the calcs better.

Out in the sun right now, I’ll read that post later!
 
I havent charged to 100% in about 4 months, at that time it was ~303miles I believe. But Ill check again when I charge to 100% next time. I would have definitely noticed if it was below 300 as its sort of a psychological treshold.

I looked at the link you provided but I fail to understand how it can account for the entire battery pack if estimated 0 range is hit before pack is fully used. So estimated range is only using usable capacity for its calculations? Why do we use capacity outside of the range screen calculations?

To maybe clarify what Im talking about. If you drive until 0%. Your estimated range will be 0 miles. So if you do the calculation it will say you are at 0 kWh. But in reality the pack has capacity leftover.

Also, for instance, if you have 1% left, your Wh/mi Avg will still be the same (because thats your usage, its same regardless of percentage of battery), so 248. At 1% the car will project something like 3 mile range. Do the calculation. You are now at 1% degradation.
This will be dissatisfying, because what you say IS logical.

But it is not the way the screen works.

It does not correctly project when you will be at 0 rated miles. It is very optimistic at 100%. It also does not correctly project when you will completely exhaust your energy, *in general*. E.g. In my car at 100% with recent efficiency of 300Wh/mi it would project a range of 236 miles. And indeed that would be exactly correct to absolute battery exhaustion. But I would only get 225 miles @ 300Wh/mi to 0%.

At 50%, 300Wh/mi, would project 118 miles. Actual 123 miles to exhaustion. 113miles @ 300Wh/mi to 0%.

Fortunately the projections get more and more conservative the lower you go. Specifically, as you approach zero rated miles remaining, the projected range remaining will go to zero. It’s exactly right about remaining range (to 0 rated miles) when you approach 0%. But you will still have the entire buffer to use.

It’s just the way it works. It has been demonstrated to be correct over and over with cross checks with SMT.

Also, for instance, if you have 1% left, your Wh/mi Avg will still be the same (because thats your usage, its same regardless of percentage of battery), so 248. At 1% the car will project something like 3 mile range. Do the calculation. You are now at 1% degradation.
As the link says, you cannot do the calculation at such a low SOC. You will have extremely large error. 75% as you did, is close enough, though, with error around +/-1% if you’re off by 0.5% on the actual SOC. (Just rough hand calculations not accounting for all error sources.)

Do report back what your 100% charge is next time you try. It will be close to 290 if the numbers you provided are correct.

This does point to how the screen works though. It will project 3 mile range or so at that point. However, you still have the entire buffer you could use (which you should not attempt to do), so your actual remaining range is considerably higher than 3 miles (if you’re lucky). @AAKEE has explained the progressive hiding of the buffer above - that is an equivalent way to think about this.

Anyway your pack is around 71kWh give or take a couple percent. The BMS is just an estimate; it can briefly be considerably off, but for most people it is quite consistent and accurate most of the time. So 71kWh has to be thought of as your pack capacity unless demonstrated otherwise by careful metering.
 
Last edited:
Heres the thing, I made it clear that its my opinion and did not try to prove it as anything, just shared my experience while also saying Im willing to provide whatever is needed to calculate the actual thing. So why you are acting as if I am saying I have no degradation based on anecdotal evidence is beyond me. I think it was clear its just an anecdote.
But that's what you said! It's too easy to afterwards say it's an anecdote and that you didn't mean it.
But you completely sweeped under the rug my argument that while in the lab SoC and temp are the only variables, when it comes to your car those are NOT the only variables for degradation. So its comparing apples to oranges. Lab tests give you an idea for aging, but its just one of many pieces of the puzzle. How this is not understood is beyond me.
Can you be more specific about the other, "variables for degradation" besides SoC and time? Thank you.
You are treating the lab results and applying them to Tesla's degradation as if batteries have infinite charge cycles and the only things that affect them is SoC and temp. Thats just simply not true, and thats a fact.
You suggest that there are other things impacting degradation besides SoC and temperature. Please could you be more specific about these? Thank you.
 
anyways. Here are the pictures of data I provided before (had to sensor the reflection/map).

View attachment 1060500
I put in the numbers for that X. We do not know much about daily charges, garage etc. so I used 25C average cell temp, which is probable if it has been outside and also 80% daily charge and 60% end of the day:
IMG_9376.jpeg

Not very far away, considering we do not have the complete picture and using the most common charging schedule.

(Might be good to know that i did suppress the higher degradation at 80% slightly and also increased the degradation at 100% slightly in the formulas to have a sloping plane downwards towards 100%. I have a plan to make a site very you can check the prognose of your car, depending on the charging habits. It would be a white lie, making sure people doesn’t start to charge to 100% based on the data I give them.
IRL the degradation should be slightly higher for the “80:iers” then in my formulas.)
also I did edit my previous post with more questions :) Battery health tracking SS while you were typing up your response.

Although I do still think that environmental variables have impact on car batteries (weather cycles, driving styles, charging speeds etc).... and cant be completely discounted. Stuff that lab cant replicate.
It would be practically impossible to cover all aspects of degradation/cyclic aging in the posts to you, but it already is covered in the hundreds of post I already made here on TMC, so the data is here.

Basically, if you ask me, the reserachers most often use too high charging and discharing current compared to a EV use.
This means many of the charts has been with 1C (about 78kW charging discharging with an 3/Y LR/P.)
This equals the middle part of a supercharging for the charge part and it also equals driving around 200kph/125 mph on the highway from start to stop of all discharges. ( the charts above was like that).
Luckily enough, there are tests with different charging rates as well.
This is a Panasonic 18650 with a the same
Chemistry as Tesla use.
(This is bit the only one showing this, so we have several examples showing the same)

The cell is 2.9Ah so thre three different charging rates showing the same degradation is 0.17C, 0.24C and 0.34C
These represent 13kW, 19kW and 27kW charing power. The degradation is the same despite different charging power. This means all AC Charging causes about the same degradation.
IMG_4996.jpeg


For driving, normal highway driving will be about 0.25-0.3C (a full charge will take 4 to 3 hours to discharge).
Most of the tests show around the same degradation rates up to 2C, (160kW alla the time from 100% to 0%) so normal use will cause about the same degradation.
Maybe-probably slow driving around the town reduce this slightly. But on the other hand a slight difference is in a low value would be not noticable.

There are differences in cyclic aging depending on temperature, not very big though for Panasonic NCA but they are already covered in the formulas by the average temp of the pack.
Thunderstorms and rainy Days doesnt make any difference except if the lightning or water goes into the pack :eek:
So the rest of the weather the pack is happily not knowing about.

All the things that actually make a noticable
difference in degradation is found in the research and is reflected in my formulas.

I havent incorporated very hard track driving, that will make a difference if it is performed very often. It would be hard
to judge the extent of it even if the data about how a high power acceleration ( = discharge) degrades the battery.

For occasional high power driving or supercharging there is a recovery effect of the cells, making them “self repair capacity” that has been noticed during the research. So for the average Tesla owner we doesnt need to count full power pulls
or supercharging sessions.
( I have around 18% supercharging on both on my ex M3P and the MSP, and I sure used the power qiute hard from time to time. O
See a Slight lowering of the capacity afterwards extensive power use or several supercharging sessions but it always climb back after anwhile of nice low cycles. This is the same om
Both cars.)
 
Yes, in a normal average climate you can expect around 5-6% the first year from calendar aging.
Having that battery at or below 55% you cut it in half, so 2.75% is expected the first year instead of 5.5% for calendar aging.

I know Texas/Dallas area and it is quite warm over the year.

The average cell temp in my (cold) place seems to be around 5C above the average ambient, seen from logs of BMS-data.

I have tested having my car out in very sunny weather with the sun as high as it gets at our place ande the cell temp seem to top out 9-10C above ambient. Not big differences between Model 3 and new S.

So to have an estimate of the average cell temp we need the average annual temp for that place and add more than 5C for Texas.

So, I guess you are below half or better by being at 3% loss as @alansubie says.
All of your reduced degradation comes from low SOC, and 0% from luck ;)

Keep on being nice to the battery, and it will be nice back.
Thanks!
 
But that's what you said! It's too easy to afterwards say it's an anecdote and that you didn't mean it.
This must be a language barrier issue. Because "I cant say I noticed X" by definition is an anecdote. As opposed to "I definitely saw X", completely different!

You suggest that there are other things impacting degradation besides SoC and temperature. Please could you be more specific about these? Thank you.

I said many times, swinging temperatures (winter/summer/day/night) while in lab its consistent temperature. Charging rates, supercharger vs lvl2. Battery chemistry, depth of discharge (someone discharging from 50% to 5% before charging vs someone who dicharges from 50% to 20% before charging), battery cycles, driving style (high rate of pull out of battery vs low rate of pull), constantly driving up hills vs always driving at sea level without elevation changes etc... there are others too. Its not just temp and SoC. This is the 3rd or 4th time I am repeating this. I am starting to get a feeling you are just being willfully ignorant as to what I say.
 
Last edited:
Do report back what your 100% charge is next time you try. It will be close to 290 if the numbers you provided are correct.

Did 100% charge, shows 298 miles (as I said last time I charged to 100% was around February, at that time it was just over 300, I think 303, this was about 4k miles ago). My total at 100% when car was new was 310 miles. So thats 3.8% degradation? Or just under 1% (0.96%) per year?

range_at_100%.png
 
Last edited:
  • Informative
Reactions: AlanSubie4Life
Did 100% charge, shows 298 miles (as I said last time I charged to 100% was around February, at that time it was just over 300, I think 303, this was about 4k miles ago). My total at 100% when car was new was 310 miles. So thats 3.8% degradation? Or just under 1% (0.96%) per year?

View attachment 1060667
A bit of variation is expected; such is life. I expect to be a few miles off if rounding goes the wrong way, and this is just a couple miles more, so it is all within reason. Energy screen would be good too while at that level. If you can also take one showing rated miles with the energy screen (so one with percent one with miles) that would help understand the vehicle constant (which I don’t know off the top of my head).

This would take you to 73kWh rather than prior estimate of 71.1kWh, on the other side of my 72kWh guess. Anyway this is around 7% assuming a start of 78.5kWh (in that ballpark is correct).

I think this vehicle started at 315 miles but I have no idea what the degradation threshold is. You can’t just look at starting rated miles for calculating capacity loss, due to that factor hiding some initial capacity loss.
 
Last edited:
A bit of variation is expected; such is life. I expect to be a few miles off if rounding goes the wrong way, and this is just a couple miles more, so it is all within reason. Energy screen would be good too while at that level. If you can also take one showing rated miles with the energy screen (so one with percent one with miles) that would help understand the vehicle constant (which I don’t know off the top of my head).

This would take you to 73kWh rather than prior estimate of 71.1kWh, on the other side of my 72kWh guess. Anyway this is around 7% assuming a start of 78.5kWh (in that ballpark is correct).

I guess there is no way to verify actual size of battery pack without taking it out right? I know that EPA got 78.3kWh out of their Y (but also that screenshot @AAKEE posted is for "performance" model so maybe it has bigger pack? But as I said before during that first year there was an update that increased range for MYLR to 316, for me it stayed 310. I wonder if my capacity was on low end?

This place says its 78.1kWh Tesla Model Y Long Range Dual Motor

This place says 77.8 kWh 2020 Tesla Model Y Long Range AWD - Specifications and price

I have notes from when I was buying it stating 74kWh (usable)....

🤷‍♀️
 
Last edited:
I guess there is no way to verify actual size of battery pack without taking it out right?
It’s 78-79kWh. Good enough for this. There’s plenty of SMT data too I assume.

The software changes don’t change that value. They change the degradation threshold or the constant. Inconsequential for this.

I’d ignore the EV Database for US.

77.8kWh is nameplate as mentioned. EPA got more which is normal for that pack.

74kWh/0.955 = 77.5kWh so it’s a good round number which is on the low side as would be expected.

Just call it 78-79kWh. Doesn’t matter.

Just go to the EPA website; it’s all there: Basic Search | Document Index System | US EPA

78.5kWh as posted above.
 
Last edited:
  • Like
Reactions: AAKEE
This is for 21 inch wheels Performance model.
No it isn’t. My gosh, I am trying to just post the info. It is right there!!! 78498Wh.


IMG_1281.jpeg

Can we stop haggling over each tiny point and just take the data that we all know to be true here? There are literally hundreds if not thousands of posts here about this information. Totally happy to have debate about stuff where there is uncertainty but some of the facts here are just facts!

Sorry, losing patience. It’s been explained how it works and the data supports your ~7% loss (which is quite good!), basically as expected. If anything you have slightly less loss than expected (@AAKEE can look into that prediction if you want), but it looks like everything basically checks out to me.
 
Last edited:
  • Disagree
Reactions: Chrushev
No it isn’t. My gosh, I am trying to just post the info. It is right there!!!


View attachment 1060746

Can we stop haggling over each tiny point and just take the data that we all know to be true here? There are literally hundreds if not thousands of posts here about this information.

Sorry, losing patience. It’s been explained how it works and the data supports your ~7% loss (which is quite good!), basically as expected. If anything you have slightly less loss than expected, but it looks like everything basically checks out to me.
Wtf? I clicked on your link. searched for the data and its only for 21 inch wheel performance model... and you are the one losing patience here? Dont post wrong links and you wont have to deal with me pointing out its the wrong link... jeez 🤦‍♀️

performance_21inch.png
 
  • Disagree
Reactions: AlanSubie4Life
Wtf? I clicked on your link. searched for the data and its only for 21 inch wheel performance model... and you are the one losing patience here? Dont post wrong links and you wont have to deal with me pointing out its the wrong link... jeez 🤦‍♀️

View attachment 1060747
It’s right in the document (which is why I screen capped it). The document is more than one page! If you search the site, and look up this document (it is easy to find), you will find it covers both the Performance (two wheel types) and AWD. It’s quite clear. For whatever reason they only posted the useful spreadsheet for one vehicle but that is not relevant.

And if you go through all the pages, you’ll find pages for Charge Depleting UDDS and Highway applicable to AWD. It covers at least three vehicles. The small-diameter wheel Performance was 78.6kWh FWIW.

Just read the docs and believe people here. There is a lot of nonsense here, of course, but I try to make it easy for people to check most of the information posted here. So you don’t just have to believe.

It doesn’t matter anyway. All the vehicles that year had the same pack, which is why they came in between 78kWh and 78.6kWh. That’s where you started. You may have been lucky and started at 79kWh (this pack is capable of that, based on Model 3 results).

Do you have those pictures in percentage and distance mode at 100%? Would be helpful for establishing degradation threshold. That will explain why you don’t just have 298/315 degradation.
 
Last edited:
  • Like
Reactions: AAKEE