This is why global warming is exaggerated:So he is calling us "boiling frogs"? LOL


Welcome to Tesla Motors Club
Discuss Tesla's Model S, Model 3, Model X, Model Y, Cybertruck, Roadster and More.
Register
Install the app
How to install the app on iOS
You can install our site as a web app on your iOS device by utilizing the Add to Home Screen feature in Safari. Please see this thread for more details on this.
Note: This feature may not be available in some browsers.
-
Want to remove ads? Register an account and login to see fewer ads, and become a Supporting Member to remove almost all ads.
You are using an out of date browser. It may not display this or other websites correctly.
You should upgrade or use an alternative browser.
You should upgrade or use an alternative browser.
Climate Change Denial
- Thread starter mspohr
- Start date
-
- Tags
- climate change
nwdiver
Well-Known Member
This is why global warming is exaggerated:
'Observations' is misspelled... how accurate can the rest of that possibly be?
Increasing CO2 from 180ppm to 280ppm is the difference between NYC on the bay and NYC under a mile of ice. What do you think 280 to 400ppm means? CO2 is the primary climate driver. Always has been. It's the reason Venus is hotter than Mercury. It's the reason Earth isn't a ball of ice.
Also... Why doesn't that ERSSTv5 graph match the ERSSTv5 graph?
Last edited:
I notice how you tend to go in a direction completely unrelated to the topic. You do that because you don't have a sound logical argument. Dr. Spencer and Dr. Christy were great atmospheric scientists in 1991, and they still are today. If they weren't, NOAA would no longer use their data and NASA would no longer fund their research. Is that too difficult of a concept for you to grasp???? What's your point? Because someone was 'quality' 30 years ago they're still 'quality' today?
Counter-point; Look want can happen in just 20 years...
From this;
View attachment 657638
To this;
View attachment 657639
Wrong! CO2 does not drive the climate. It follows the climate. Perhaps you don't have a clue that the ocean contains 60 X the CO2 the atmosphere does. When the oceans warm, it releases CO2 into the atmosphere. When the oceans cools, it absorbs CO2 back into the oceans. Think of a coke can you leave in a car during a summer afternoon. Open the can. maybe you will grasp the concept.'Observations' is misspelled... how accurate can the rest of that possibly be?
View attachment 657641
Increasing CO2 from 180ppm to 280ppm is the difference between NYC on the bay and NYC under a mile of ice. What do you think 280 to 400ppm means? CO2 is the primary climate driver. Always has been. It's the reason Venus is hotter than Mercury. It's the reason Earth isn't a ball of ice.
Also... Why doesn't that ERSSTv5 graph match the ERSSTv5 graph?
View attachment 657642
nwdiver
Well-Known Member
Wrong! CO2 does not drive the climate. It follows the climate. Perhaps you don't have a clue that the ocean contains 60 X the CO2 the atmosphere does. When the oceans warm, it releases CO2 into the atmosphere. When the oceans cools, it absorbs CO2 back into the oceans. Think of a coke can you leave in a car during a summer afternoon. Open the can. maybe you will grasp the concept.
If CO2 doesn't drive climate then what does? The tiny orbital wobbles are far too small to cause ice ages then end them. You need a feedback. What's the feedback? Orbital wobbles trigger the climate shift... sure. What DRIVES the climate shift. The feedback is CO2. If not CO2... what?
Small temperature increase from orbital shift => 'When the oceans warm, it releases CO2 into the atmosphere.' => large temp increase => 'When the oceans warm, it releases CO2 into the atmosphere.' =LARGER temp increase....
Small temperature decrease from orbital shift => 'When the oceans cools, it absorbs CO2 back into the oceans.' => large temp decrease....
Yeah... I get it... do you? You can't seem to see the forest through all those trees...
")
Also... why does't the ERSSTv5 from Spencer match ERSSTv5 from everyone else?
Last edited:
Raffy.Roma
Rome (Italy)
Hurricanes are originated when in the Ocean there are at least 8 meters of hot water. FYI Oceans in front of the USA have 16 meters of hot water.This is why global warming is exaggerated:
Do you still think that global warming Is exaggerated?
This is why global warming is exaggerated:
His last award was in 1996 when he presented findings with erroneous data. (Roy Spencer (scientist) - Wikipedia)
Did you read the link I posted? He works at UAH now and is now on team 'yes there is global warming'.
What were you trying to 'prove' with that chart? Looks like an upward trend to me.
A related chart, but this talks of S&P 500 and money printing.

An analysis on the S&P500 and money printing for OANDA:SPX500USD by atlas_crypto
To most in the financial industry, the stock market has completely recovered and made new highs. However, this is unfortunately not the case at all. A large portion of the recovery in the stock market has been caused by the federal reserve printing the most money they've printed in US history...
 www.tradingview.com
Last edited:
Do you know who Jeremy Corbyn is? In case you don't know, he is the British Labour Party Leader. Most people who pay attention to global politics know who he is. What most people don't know is that he has an elder brother named Piers Corbyn. Piers is a meteorologist and astrophysicist. Allow Piers Corbyn to explain to you the fallacy of CO2 driving the world's climate. Go to 41:50.If CO2 doesn't drive climate then what does? The tiny orbital wobbles are far too small to cause ice ages then end them. You need a feedback. What's the feedback? Orbital wobbles trigger the climate shift... sure. What DRIVES the climate shift. The feedback is CO2. If not CO2... what?
Small temperature increase from orbital shift => 'When the oceans warm, it releases CO2 into the atmosphere.' => large temp increase => 'When the oceans warm, it releases CO2 into the atmosphere.' =LARGER temp increase....
Small temperature decrease from orbital shift => 'When the oceans cools, it absorbs CO2 back into the oceans.' => large temp decrease....
Yeah... I get it... do you? You can't seem to see the forest through all those trees...
Also... why does't the ERSSTv5 from Spencer match ERSSTv5 from everyone else?
View attachment 657643View attachment 657644
By the way, your desperate attempts to discredit Dr. Spencer because of the ERSSTv5 observations are due to your lack of thought and silliness. Do you know what an ordinate is? It is the y-axis if you need help. Look at the left graph you posted. The ordinate has a range of -0.6C to 2.0C. Now look at the right graph. The ordinate range is -0.4C to 1.0C. This creates a visual distortion of the graphs. The smaller temperature range of the graph on the right creates a more dramatic appearance of a temperature rise. The abscissas are different as well. The graph on the left goes from 1979 to 2030. The one on the right goes from 1920 to 2020. Of course the graphs won't look the same. Now take a look at 1998. That was an El Nino year. You can see the peaks in both graphs. Take a look at 2016 - a powerful El Nino year. Those peaks match as well. The graph on the right stops before 2020. The graph on the left continues into 2021 where you can see the recent cooling trend. This is because La Nina conditions are dominating.
There now. Did I get your head screwed on straight for you?
There is a wide range of data you can pick and choose from like the hysterical YouTube video you posted. I can easily counter that with this:His last award was in 1996 when he presented findings with erroneous data. (Roy Spencer (scientist) - Wikipedia)
Did you read the link I posted? He works at UAH now and is now on team 'yes there is global warming'.
View attachment 657697
What were you trying to 'prove' with that chart? Looks like an upward trend to me.
View attachment 657698
A related chart, but this talks of S&P 500 and money printing.
An analysis on the S&P500 and money printing for OANDA:SPX500USD by atlas_crypto
To most in the financial industry, the stock market has completely recovered and made new highs. However, this is unfortunately not the case at all. A large portion of the recovery in the stock market has been caused by the federal reserve printing the most money they've printed in US history...
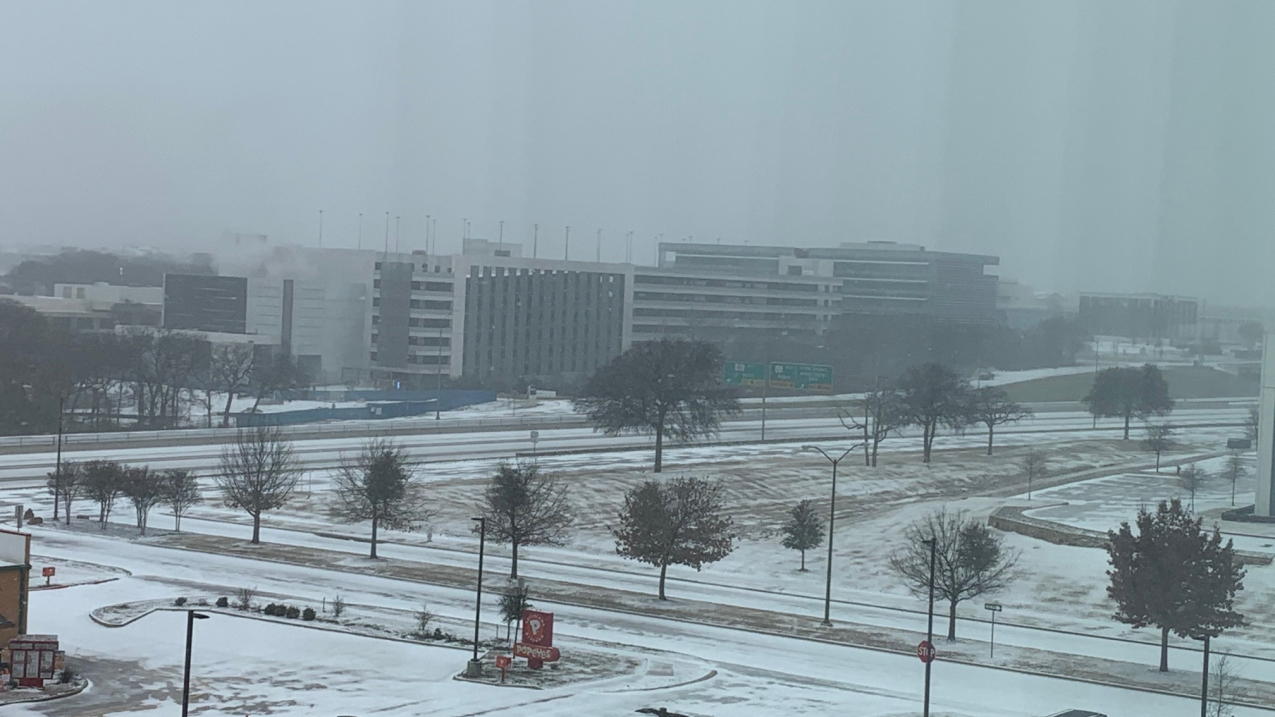
U.S. had its coldest February in more than 30 years
Record-breaking deep freeze engulfed much of Texas
nwdiver
Well-Known Member
Look at the left graph you posted. The ordinate has a range of -0.6C to 2.0C. Now look at the right graph. The ordinate range is -0.4C to 1.0C. This creates a visual distortion of the graphs. The smaller temperature range of the graph on the right creates a more dramatic appearance of a temperature rise. The abscissas are different as well. The graph on the left goes from 1979 to 2030. The one on the right goes from 1920 to 2020. Of course the graphs won't look the same. Now take a look at 1998. That was an El Nino year. You can see the peaks in both graphs. Take a look at 2016 - a powerful El Nino year. Those peaks match as well. The graph on the right stops before 2020. The graph on the left continues into 2021 where you can see the recent cooling trend. This is because La Nina conditions are dominating.
There now. Did I get your head screwed on straight for you?
???? What are you talking about??? They're clearly not the same....
Also... if CO2 isn't the feedback that thaws the Earth after an Ice age... what is?
Also.... you realize that CO2 levels in the atmosphere AND the oceans are currently rising... right? The increase in CO2 we're observing now is anthropogenic in origin NOT from the oceans. We know this because math. Our pathetic addiction to fools fuel is adding ~40B tons/yr to the atmosphere. Run the numbers. Earths Atmosphere is ~5E18kg adding ~40E12 kg CO2/yr. 40E12 / 5E18 = 8ppm. We're adding more than enough CO2 annually to be 100% responsible for the observed increase of ~2.5ppm/yr. The remainder is being absorbed mostly by the oceans...
Last edited:
There is a wide range of data you can pick and choose from like the hysterical YouTube video you posted. I can easily counter that with this:
U.S. had its coldest February in more than 30 years
Record-breaking deep freeze engulfed much of Texaswww.noaa.gov
So the guy retracted his study and you still think his old study was right? That sounds really Drumpf! Do you still think the Earth is flat?
cpa
Active Member
i am amazed at the patience in the last few pages of “discussion”
Recess is over, and we are all back in the classroom.
I found it interesting that other articles in this journal included a tirade against gay marriage (on the basis that this would promote incest!), an article on how prayer is the best solution to COVID, and a curious article about how Chinese communism is perverting Australias Universities.
So, obviously an excellent source of unbiased, factual information! How stupid of me to rely on all those naughty, peer-reviewed and carefully researched science papers when I could have just checked this truly illuminating source of truth!!
Silicon Desert
Well-Known Member
I guess climate change denial comes in many forms. I have been telling the wife that all this last week, I have been too cold at night. She denies it and says there is no problem. The heater is working fine.
Do you really, seriously, believe what you said? There are only three possibly ways to interpret what you are saying:So, have you studied thermodynamics?
The climatologists have the thermodynamics and physics wrong. They measure radiative transfer and think it represents the thermodynamics. Cooler things never heat warmer things, but that is exactly what their (stupid) models do.
1. All those (literally) thousands of scientists, all around the world, from varied nationalities, faiths, cultures, and political opinions, all of them, have failed to understand basic high-school thermodynamics, and that every single carefully peer-reviewed article has failed to notice this?
2. They do understand thermodynamics, but are involved in an international conspiracy (for ... er .. reasons) to convince everyone of a fake climate catastrophe, using fake science, faked articles and fake peer reviews that are carefully orchestrated and coordinated world-wide.
3. You dont understand thermodynamics as applied to climate change.
Now, I wonder which of these options is (a) plausible and (b) the most probable? Hmmmmmmm ... tricky.
JRP3
Hyperactive Member
He made the idiotic statement that termites produce more CO2 than man, apparently without the basic understanding that termites are part of the natural CO2 cycle of recycled plant material which have been occurring for millennia while man made emissions from fossil fuels are not.Allow Piers Corbyn to explain to you the fallacy of CO2 driving the world's climate. Go to 41:50
Good gawd you're dense. What you fail to grasp is that the ERSSTv5 data set is being displayed with different time periods and a different temperature range. Plus, the temperature anomaly in the left graph is based on the 1979-1983 average. The temperature anomaly in the right graph is not defined. But it is obviously defined differently. This is why they look different. At 1980, the temperature anomaly in the left graph is around 0.0C. The temperature anomaly in the right graph is 0.2C in 1980. This tells you the temperature anomalies are computed from different averages.???? What are you talking about??? They're clearly not the same....
View attachment 657769
Also... if CO2 isn't the feedback that thaws the Earth after an Ice age... what is?
Also.... you realize that CO2 levels in the atmosphere AND the oceans are currently rising... right? The increase in CO2 we're observing now is anthropogenic in origin NOT from the oceans. We know this because math. Our pathetic addiction to fools fuel is adding ~40B tons/yr to the atmosphere. Run the numbers. Earths Atmosphere is ~5E18kg adding ~40E12 kg CO2/yr. 40E12 / 5E18 = 8ppm. We're adding more than enough CO2 annually to be 100% responsible for the observed increase of ~2.5ppm/yr. The remainder is being absorbed mostly by the oceans...
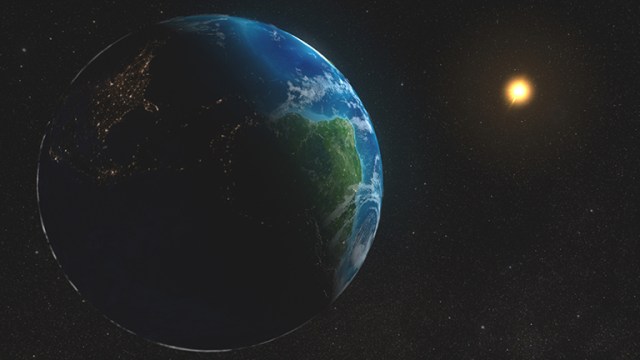
Concerning what triggers the glacial-interglacial cycles, the Milankovitch Cycles are a possibility. But it isn't really known.
Milankovitch (Orbital) Cycles and Their Role in Earth's Climate - NASA Science
Small cyclical variations in the shape of Earth's orbit, its wobble and the angle its axis is tilted play key roles in influencing Earth's climate over timespans of tens of thousands to hundreds of thousands of years.
JRP3
Hyperactive Member
Too bad you don't read your source material more closely. Linked within your article:Concerning what triggers the glacial-interglacial cycles, the Milankovitch Cycles are a possibility. But it isn't really known.
Why Milankovitch (Orbital) Cycles Can't Explain Earth's Current Warming - NASA Science
In the last few months, a number of questions have come in asking if NASA has attributed Earth’s recent warming to changes in how Earth moves through space around the Sun: a series of orbital motions known as Milankovitch cycles. What cycles, you ask? Milankovitch cycles include the shape of...
But Milankovitch cycles can’t explain all climate change that’s occurred over the past 2.5 million years or so. And more importantly, they cannot account for the current period of rapid warming Earth has experienced since the pre-Industrial period (the period between 1850 and 1900), and particularly since the mid-20th Century. Scientists are confident Earth’s recent warming is primarily due to human activities — specifically, the direct input of carbon dioxide into Earth’s atmosphere from burning fossil fuels.
Similar threads
- Replies
- 66
- Views
- 6K
- Article
- Replies
- 1
- Views
- 5K
- Replies
- 48
- Views
- 4K
- Replies
- 19
- Views
- 2K
- Replies
- 3
- Views
- 3K