So, I would bet your battery is the same as my Model 3 given your timeline and what we know about deliveries to Europe from China (see graphics 1 and 2). My M3 LR AWD (registration document "EC5D") was delivered (in France) on September 30, 2021. Sorry this first URL is in French:
Batteries et autonomie à 100% des Model 3 LR / Performance - Forum et Blog Tesla
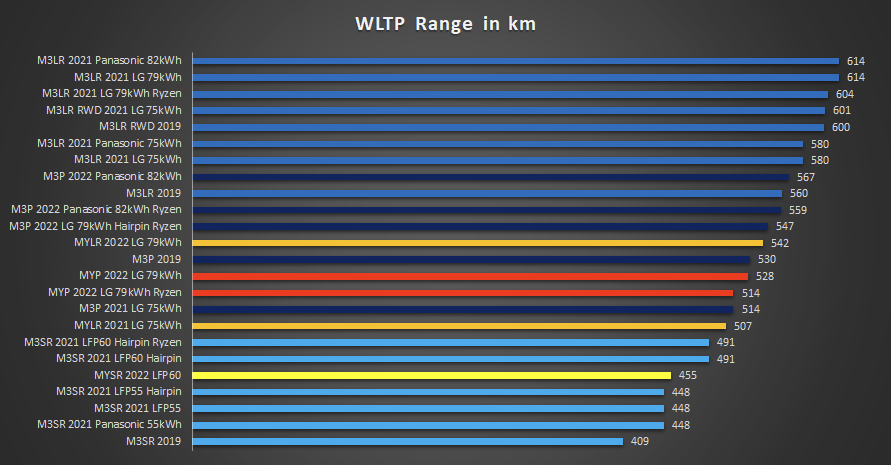
Refer to Q3 2021 in graphic 2:
https://teslamotorsclub.com/tmc/attachments/1630346415996-png.703246/
These above are the arguments I use to say your M3
appears similar to mine.
The graphic you show from "Tessie" does indeed suggest that you have experienced no "degradation" since delivery. It's my opinion that this graphical representation is misleading.
Why?
I would first refer you to the multiple posts and solid reasoning of
@AAKEE on this particular master thread. He's really a sage on all this and can enlighten you on how to treat your M3 battery whether LCA or NMC. His recommendations certainly strongly influenced me on how to treat my M3 battery.
Second, there's a lot of hype about "degradation" and everybody quotes max rated range which can, erroneously in my opinion, show no "loss" of range for a long time. Here, there are several points that should be considered:
1) These data are supplied by the BMS, that magical citadel few really understand fully, including me.
2) Included from this BMS are data for max rated range, SoCs, NFP and so on (certainly if you look at these in SMT).
3) Some of these signals are very "noisy", such as max rated range (MRR), which is really
much more so than NPF, particularly when you compare them graphically and calculate the Standard Deviation of the data sets (from SMT, my NFP data set is ~x10 less noisy than my MRR data set).
4) Some have criticized the calculation of degradation via NFP/(Full Pack When New). Sure, I just happen to think this is a more reliable calculation than plotting max rated range against the odo. Or at least, I would just plot MRR against elapsed time thus only using
one BMS parameter in the plot, not two (lowers errors x errors!).
5) In the end, there's no easy way to calculate "degradation". Look at this nice graphic from
Degradation (thank you, Amund Børsand, developer of SMT). On this graphic your M3 will likely have some degradation in your mileage timeline (~2.4% @ 6500 M, as calculated from the graph which also seems to accord with my ~1.4-1.7% degradation @4250 kM) calculated from NFP. Yes, I know that data is an aggregate battery plot!
I'll leave you to decide and form your opinion on what I've said. Rather long, sorry. However, there's a lot of uninformed opinion on this subject. There, I've stuck my neck out for chopping off
One last thing, I absolutely love my M3, it's a fantastic car, don't extrapolate my comments as negative!