Welcome to Tesla Motors Club
Discuss Tesla's Model S, Model 3, Model X, Model Y, Cybertruck, Roadster and More.
Register

Shorting Oil, Hedging Tesla

This site may earn commission on affiliate links.
Fun math problem for the day: How many barrels of gasoline can 1 Bcf of natural gas replace?

Suppose you have about 10M EVs. Burn 1 Bcf/d in an efficient CCNG plant to produce 125GWh per day. This powers the cars about 39 miles per day, where efficiency is .32kWh/mile is comparable to 25 mpg. (Also .25kWh/mile comparable to 32 mpg provides the same 8 kWh/gal ratio.)

So 1 Bcf/d can offset 372k b/d of gasoline. This is possible because CCNG plants and EV drivetrains are both highly efficient and EV.

Moreover, with natural gas priced at $4/Mcf, this works out to about $0.032/kWh or $0.01/mile for fuel. A barrel of gasoline could be replaced with $10.75 of natural gas.
 
This is an interesting way to put things. Based on the US President's recent executive orders, it appears that the US is proceeding down the well understood general economic relationship that economic growth is dependent on increased emissions. Oops.

I wonder what it would take for "lowering emissions are required to grow the economy" to become the belief system the US was operating from?
Sacrificing solar and wind jobs to prop up dying coal jobs sure comes close to slowing the economy to emit more carbon.
 
  • Like
Reactions: neroden
Huge 300,000 Bpd Fracklog Could Derail Oil Price Recovery | OilPrice.com

300kb/d of DUC (drilled but uncompleted) well inventory is on the sideline. I suspect that these producers are constantly watching the futures curve to decide if they can sell forward and bring DUCs into production.

I suspect that this behavior is imposing some downward slope pressure 2018 and beyond.

Meanwhile, the US commercial crude stock is still building, even by a mere 0.9 million barrels last week. The front end contango is fairly weak.

So we still have a one hump camel, but the hump is very flat. I can't tell where this is headed. It seems that if the DUC folks keep selling 2018 futures, it could push down the front end and spot price. But I can't tell how desparate DUC folks are to accept low futures prices. But they may have no better options any time soon.
 
  • Like
Reactions: neroden
2000x-1.png

For those who have had difficulty visualing a futures curve, this chart should help.

The red curve is from Nov 29, just a day before OPEC agreed to a production cut deal. So this futures curve shows a steep contango that is nearly linear into the far end. This was the sort of steep contango that was necessary to put a floor on the price of oil.

The blue curve is what I've been calling a one hump camel. You can see the top of the hump peak in early 2018. You can see that to the right of this hump expectations have fallen substantially since the OPEC production agreement. I noticed this back end falling for quite a while, and figured that it would take down the front end too. And it did. The back end suggests that the market knows that this glut will take many more years to clear. There are just enough marginal producers to extend the glut. It is understandable that those producers who are bringing on new supply would be inclined to hedge a lot of it. At least the hump has some ok prices for the time being. Meanwhile speculative longs have been bidding up the front 12 months of the futures curve. I think this is why the hump exists. So naturally producers should lock in that enthusiasm while it last.

Eventually, I think the futures curve will revert to long and deep contango as in Nov 29. But the whole curve may be shifted down consistent with declining long term outlook.
 
Why wouldn't the DUC's will just sell further out, leveling prices out completely. It must be cheaper to store the oil in the ground then above.
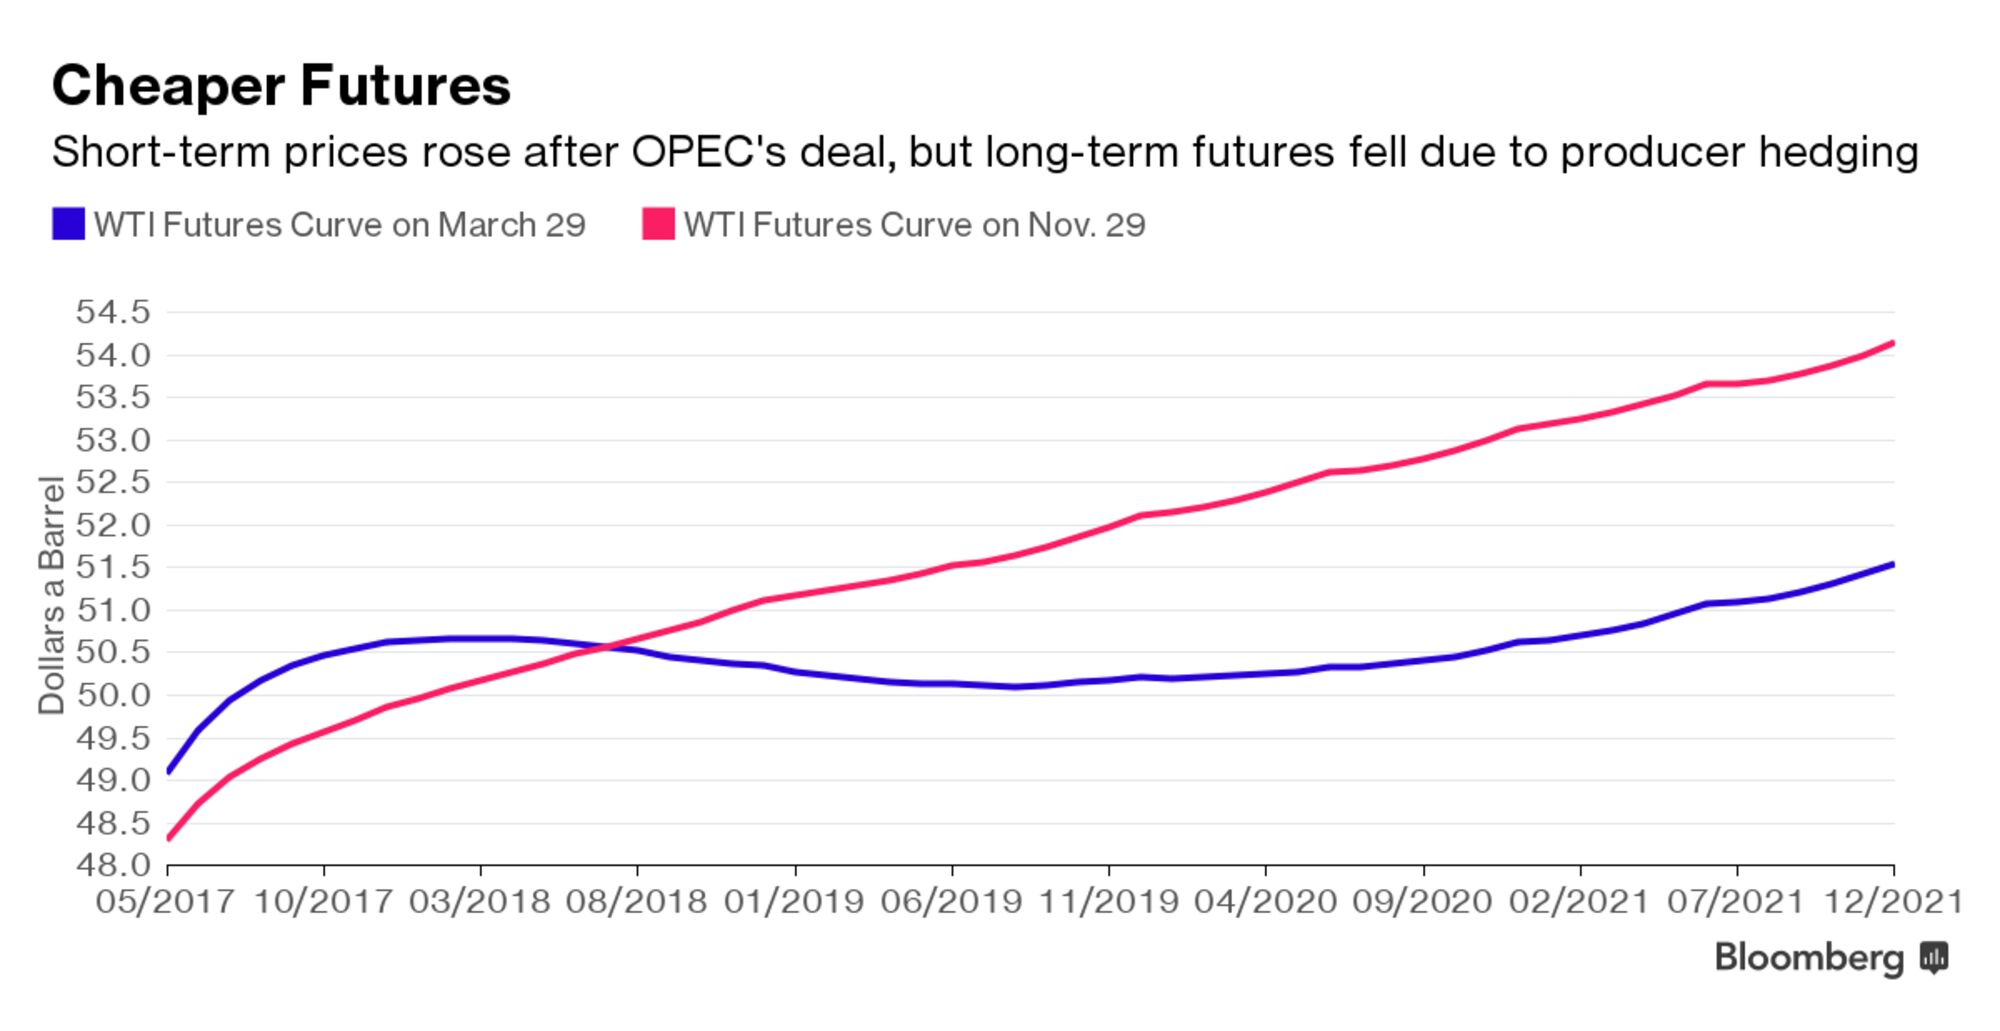
Good question. In general, I would suspect that it is hard to wait when you have debt to pay. But lease contract also may be a factor. Some producers needed to drill DUCs recently to keep their leases. It gives them a two year extension. So I suspect that beyond an extension, producers may need to actually complete some wells.

So it is curious that there is this valley a few years out in the futures curve. It just seems picked over. You can get some ok future prices in late 2017 or wait until 2021. That's a pretty sad choice if you're sitting on an inventory of DUCs, even if you don't have any lease or debt issues to worry about. The other option is to forego hedging and just hope oil prices get better.

Now if the futures curve had a strong upward slope, you could maybe find investors to buy your DUCs and hold them till the price was good, even if you were not financially able to go without cash flow for that long. But the futures curve may be telling us that the market really is oversupplied for many more years. With this inventory of DUCs in waiting, it could be that there is a cap on the futures curve out through 2021. Basically, every time the curve rises sufficiently high, somebody will hedge a DUC for future production. So this could keep the curve low for quite a while.

I just count my blessings that I am not in the oil industry.

By the way, looking closely at the Brent curve, I have a hunch that Brent will fall again soon. It has a valley that is lower than the first front month, and the front peak is just a few months out and very shallow. The image that comes to mind is the Dutch boy with his finger in the dyke. The contango needs to deepen or inventory will flood the market. Either way the likely outcome is a decline in the spot price.
 
India aims to become 100% e-vehicle nation by 2030: Piyush Goyal

This is the sort of infrastructure play in India that we have been discussing more generally.

India has a long history of subsidizing imported fuels, and it is arguably a drag on the economy. So what if they reversed course an imposed negative subsidies on gasoline, and used the net savings as subsidy for EVs? This does several things:
1) Cut cost of EVs to consumer. EV fleet grows fast.
2) Raise cost of ownership of gasoline vehicles. Gas fleet declines.
3) Demand for grid power increases. Stronger economic base for expansion of grid.
4) Decreased import of oil and gasoline. Ease trade deficit.
5) Reduced need for refinery capacity to be built.
6) Stronger sourcing of domestic and renewable energy. Increase domestic job creation.

So the core issue here is how to harness an energy transformation to support high economic growth rates long term. Importing fuel is essentially outsourcing energy and technology jobs while straining the Rupee. India can redirect that outflow of economic opportunity. EVs and renewable energy are key.
 
How long does it take to process hedging?

Just over the last 12-24 months the new reality of looming peak demand is almost an accepted concept for people tapped into the energy markets daily. I see no angle outside of WWIII that puts oil back where it once was, the factors pushing against that(now from all sides) seem too impenetrable to have any kind of sustained run above $70 or $80.

Hedging in this low price environment probably feels wonderful to airline executives and other big players who are flush with cash and can preserve their existence for what must feel like a cheap price. But at what point does that slow by a tangible amount? Is there potential for it to fall off a cliff? Eventually human nature will force these people to simply stop hedging like it's 2006 and settle in for the long haul with low energy costs.

Is that the dynamic currently keeping brent above $40? Are we gorging on cheap hedges to an illogical extent? What does that unwinding look like?

Perhaps I'm over-estimating the effect of hedging, but prices right now should be at $40 right?
 
  • Like
Reactions: neroden
Fuel-Conscious U.S. Drivers Crimp OPEC’s Bid to Raise Oil Prices

There's some good stuff here. The main point for me is that others are recognizing that demand elasticity is increasing, and that EVs and other alternatives are driving this elasticity.

The deeper economics here is the power of OPEC to drive up total revenue by cutting supply rests on how inelastic demand is.
 
Japan is investing heavily in overseas renewables
Are Gulf Oil Producers Falling Into The ‘Venezuela Trap’? | OilPrice.com

These two articles show quite a contrast. Japanese banks are pouring billions into GW scale renewable projects around the world.

Meanwhile, countries like Abu Dhabi and Venezuela are getting desperate for financing and working out loans payable in oil.

Japan is stuck with negative interest rates so solar and wind project provide stable incomes at good interest rates. It is not surprising that there would be strong appetite for these investments.

On the other hand, oil and gas investments are looking shaky. Trouble getting financing will shrink the oil supply.

Ultimately, the race between renewables and fossil fuels will be decided by investment dollars. When we see that renewables attract more investment each year than oil, we will know that oil is in decline. I'm not sure how many more years this will take, but it looks like 2017 could see string movement this way.

Next up, Japan could throw some serious financing behind batteries.
 
Financing acts as a retardant or accelerator of technological changes. Back in the Middle Ages when there wasn't much financing and cash was king, technological change diffused slowly but steadily, as people were able to afford to buy the new technology or learn how to. Now, financing -- loans etc. -- can prop up an old industry beyond its natural lifespan, or accelerate the arrival of a new industry. When the mood changes in finance, the situation "on the ground" can change much faster than it did in a non-financialized economy.

This is probably a third reason why people are underestimating the speed with which we switch to renewables. (In addition to not understanding the exponential growth curve, and not comprehending the significance of crossing price parity.)
 
Of course OPEC is going to say rebalancing is occurring.
SeekingAlpha said:
Crude stockpiles are starting to decline in a sign that the production cuts implemented this year are bringing the market to balance, according to OPEC's Secretary-General Mohammad Barkindo.

"I remain cautiously optimistic that the market is already rebalancing," he told reporters in Baghdad.

Oil had its biggest weekly increase in 2017 last week, with futures advancing 5.5% to climb back above $50 a barrel.


Is the oil market rebalancing? - The United States Oil ETF, LP (NYSEARCA:USO) | Seeking Alpha
 
I've been going back to economic first principles to better understand the role of demand elasticity in the crude market. So I want to make a few points that should help our ongoing discussion.

First, what is price elasticity of demand? PED is the ratio of the relative change in quantity demanded (Q) per relative change in price (P). Or in notation where "dX" means the change in X,

PED = dQ/dP×P/Q

The literature on PED for crude offers a range from -0.9 to 0, with the bulk between -0.3 and -0.1 and median -0.13. This range is relatively inelastic. For example, with a PED of -0.2, a 10% increase in price from say $50 to $55, then we would expect quantity demanded to fall 2%. Or put another way, 2% decline in production would be necessary to boost the price of crude 10%. This is roughly what OPEC is trying to accomplish through a production cut.

This raises the question about how a major oil producer decides to increase or decrease production. An increase can gain market share, but it can depress prices on already substantial market share. So let's do the math.

Suppose a certain producer sells quantity Q_0 in a market of quantity Q. So it has market share K = Q_0/Q. This producer has revenue

R_0 = P×Q_0

Marginal revenue is

dR_0/dQ_0 = P + Q_0×dP/d's
= P + K Q dP/dQ
= P (1 + K/ PED)

So our producer will want to increase production when marginal revenue is in excess of marginal cost, C. Thus, when
P (1 + K/ PED) - C >0.

This condition on marginal income can be expressed is margin profit rate, thusly,

(P - C)/P > - K / PED

Keep in mind that PED is a negative number. So what this condition for increasing production means is that the marginal profit rate for a major producer needs to be proportional to its market share. Thus, bigger producers are looking for a bigger markup opportunity before they take on a project to increase supply.

So think about Saudi Arabia sitting on about 10% market share. If PED is about -0.13, then the Saudis are looking for a markup of about 77% = 0.1/0.13. I think this is about right based on behavior.

Now consider what happens if new technology inceases absolute elasticity. Suppose PED shifts to say -0.4. Then the Saudis would be looking to increase market share if they could get a markup of just 25% =0.1/0.4, whereas they used to pass on anything with less than a 75% markup in the past.

The astounding implication here. Is that as oil demand becomes more elastic, oil producers will fight more fiercely for market share even as their profitability declines. We should see consolidation across the industry. So watch merges and acquisitions rise. Meanwhile petrostates will falter from declining margins. The enormous profitability of crude has been derived from lack of any clear alternative, but all this is changing.
 
  • Love
Reactions: neroden

I haven't yet read this article, but while people are getting all excited about storage coming down and supply/demand balancing, I'm not seeing people being nearly as quick to point out that this requires a chunk of market participants to voluntarily forgo pretty significant volume. What happens when they stop deciding to forgo that volume? Does anybody believe that OPEC is going to continue taking their production off the market to balance what everybody else (esp. US shale) is doing?

This is a market with 1.8M bpd production in voluntary production cuts (source). I realize that compliance isn't 100%, but it's been pretty good, and I figure that's pretty much all production that can be switched back on anytime.
 
  • Like
Reactions: neroden