Welcome to Tesla Motors Club
Discuss Tesla's Model S, Model 3, Model X, Model Y, Cybertruck, Roadster and More.
Register

Solar happenings

This site may earn commission on affiliate links.
In my first paragraph I said If you have solar in VT, and you are connected to the grid, then they don't allow TOU rates. I think you didn't understand my last sentence because I said they don't allow TOU rates with net metering. There would be value (in VT) in home storage but only if you had TOU rates and no solar, OR you went off the grid. I haven't checked to see what Green Mtn Power is offering with the Powerwall but there must be something compelling because they became a Tesla Energy Partner.


Yes we were talking past each other. I understand that if you are selling to the grid in Vermont you can not have TOU. I think the misunderstanding could be in what each of us mean by "connected to the grid" . My point was that the cost effective battery option with the PowerWall means you don't have to ask for permission to install solar because the battery can store your solar generation and you are not selling to the grid. You can still be connected to the grid, but just not selling to the grid. You would not be on Net Metering because technically your solar and batteries are "off the grid" because they are behind your meter and operate in purchasing mode and do not sell to the grid. Net Metering is what we have to ask permission to do. We only need a building permit to install solar and batteries if we are not grid tied.

Theoretically, in Vermont you could be on a TOU rate, charge your batteries at the low TOU rate or from your solar. Then you could use your solar and batteries to run your house during the high TOU rate period. That could save some money if the rate differential is large enough. I think it will be interesting to see what Green Mountain is doing. Other utilities in California are installing battery systems because batteries can respond faster that Peaker Plants, and are more cost effective that buying power from Peakers. That is the value equation that makes solar and batteries a cost effective solution. And that is the value that batteries have when used in combination with solar. Did that explanation make my theory more clear?
 
Last edited:
  • Like
Reactions: dhrivnak
Nevada may not lift 3% Net Meter cap

Net metering caps are generally expressed as a percentage of the maximum capacity a utility delivers. The STC rating hitting 3% of this value, in this case, becomes the shut-off to new net metered connections. While we're on the topic of VT, they recently went through this and ended up at 15% (?). Nevada is more apt to follow AZ's footsteps, unfortunately.

Lawmakers: No intention to continually raise net metering cap | Las Vegas Review-Journal

It's the latest. No resolution, yet. The PUC gets the ball, to draft a new tariff. NV owners should get ready for flat charges, lower net metering rates of $.05-.10, and potential demand charges at peak sun, Tesla charging, etc.
 
Was it 15%? Anyway, we negotiated with the utilities and had to give them a lot of concessions to get this.

In MA, we gave up the ability to virtually net meter to third parties, which amounts to assigning your solar power to anyone you designate from the same region. In some ways that gave up a free market for solar watts, but it wan't near the give ups others look like they face.
 

Low bids on project in Jordan likely to trigger solar energy boom

The lowest ever bids for a solar power project in Jordan could lead to a boom in the region – especially in Saudi Arabia, industry experts say.
“The Jordanian solar market is going to be booming now that solar energy is evidently cheaper than conventional energy,” said Hadi Tahboub, the regional executive director of development at SkyPower, a UAE firm and bid participant.

He said that the company expected Jordan’s solar photovoltaics (PV) market to boom and trickle into other areas such as Saudi Arabia.

The second round of Jordan’s solar independent power producer (IPP) tender, totalling 200 megawatts, drew the lowest rates for a solar project in the country. The top four bids will each be awarded 50MW.

The lowest bid came from a relatively unknown Greek firm, GI Karnomourakis SunRise PV Systems, at 6.13 US cents.
 
  • Informative
Reactions: dhrivnak
These charts surprised me. They're the real-time metering info from ISO New England, the grid operator. It's almost noon on a nearly cloudless day across the region, yet solar is just a rounding error (1.9 MW of 13,738 MW total). The 15% coal is really surprising, given recent retirements of older coal units. The second chart is a drill-down on the 7% renewables wedge in the first chart.
View attachment 70677View attachment 70676
These data omit behind-the-meter generation (which reduces load, from ISO's perspective), but still, it shows how much farther we can go getting solar installed in New England before we have system issues.
Still no solar panels, but wind went up:

Screen Shot 2017-03-12 at 4.01.10 PM.png
 
neroden said:
Soooo, while everyone's talking about storage (and batteries will start being installed, in a big way), the other thing which could happen is grid transmission.

With the huge daytime solar production in California, I'd expect them to be pushing that energy out to cloudy Oregon and Washington, if the wires are available.


The wires are absolutely available. CA imports a huge amount of power from PacNW, so all you would be doing is reducing imports, not actually flipping net flow. The difficulty is the inter-control area transfers are scheduled in hour-long blocks (in the West), which makes it tough to balance solar.
Is that still true?

I'm looking at yesterday's CAISO (Saturday, so weekend use patterns):

First, solar did 14%:

California ISO - Renewables Reporting:
Screen Shot 2017-03-12 at 4.24.47 PM.png

California ISO - Todays Outlook gets updated constantly, so data lost each new day:
Screen Shot 2017-03-12 at 4.06.58 PM.png

Screen Shot 2017-03-12 at 4.08.06 PM.png


See those jagged edges on solar and net demand? Does that mean a monster cloud covered every utility solar all at once, or they're not dispatching as much?

Today (Sunday) is almost as sunny as yesterday, but yet, look at today's graphs (they match up one hour off from yesterday because "Daylight Savings Time" started today):

Screen Shot 2017-03-12 at 4.13.29 PM.png

Screen Shot 2017-03-12 at 4.13.48 PM.png


They are even more jagged. Clouds, really? Notice 12-16 today; the sun was still shining all day at my home. But, I am suspicious the operators were crying fowl that they only got to deliver 11GW of fossil fuels plus hydro and nuclear, so less solar was dispatched. It seems like the solar dispatch coincides with how much people are using the grid, despite an 11GW sink of non-"renewables" still being delivered at the minimum point at 12:00. Check wind: it doesn't describe the discrepancies.

Now, look at this morning's CAISO 15 minute price map:

ISO Today app (iphone, android) prices in $/MWh, and the "marginal" seems to be for California:
IMG_6077.small.png

And right now:
IMG_6092.small.png

The above maps have a help button that says "The ISO runs its market a day ahead for each hour of the following day, then every 15 minutes prior to real time, and then dispatches resources 5 minutes before real time to balance supply and demand and manage the transmission system."

So, the prices were negative, meaning they were paying utilities to use electricity. They are now again, too. First, why is it OK to make energy prices negative for so long? Second, why is this perverse incentive being made to avoid clean energy use?
 
Last edited:
  • Like
Reactions: dhrivnak
  • Informative
Reactions: Ulmo
Thank you. I finished the UC Berkeley Grad student's paper. It explains what I'm seeing now better. There's still some work to be done to the grid to make it handle the value of flexibility, but I need to look at the current status.

Unfortunately, the social circles don't include us people as much any more; the head of that program at CAISO is Chinese (from Bejing U), and so is the author of a paper that describes the one missing component at one of the "research paper" sites. As it is, I feel lucky they let us know anything, but my information is still years behind on what they're doing now, and it seems like they dragged their feet to do what they should have done long ago, and I think it's because they're culturally different and not communicating with us US citizens.
 
Was there some weather in California yesterday and today I did not know about? That could explain this, but I'm somewhat suspicious nevertheless.

I'm showing that while Monday had low sun at my home, Tuesday-Thursday had heavy sun, and I made quite a bit of electricity. I usually experience commonalities between what my system makes and what the utility level solar farms make.

California's solar farms are partially tracked by CAISO. California ISO - Todays Outlook shows curtailment link. The graphs show today (and now that I look at them, yesterday) had sharp drops in solar and wind during pretty high wind periods that suggest not all of the sun and wind energy was used, and that there may have been heavy curtailment. It is supposed to be updated every day, but Tuesday and Wednesday are mysteriously missing. I suspect that they might be trying to fudge the numbers to cover up how much curtailment has been going on this week.

Curtailment, according to mblake's last linked article, can be strategically used as reserves in small amounts, but bigger amounts of curtailment are more about giving more citizen money to fossil fuel companies, or in some instances, bad planning in grid expansions, but as grid expansions are continuing to fix those errors, that becomes less and less likely. I suspect a combination of all of those things. But if it's a cover up, then I suspect more of the corrupt versions than the non-corrupt versions.
 

Attachments

  • ems_renewables-20170323.gif
    ems_renewables-20170323.gif
    10.2 KB · Views: 43
  • Screen Shot 2017-03-23 at 5.11.26 PM.png
    Screen Shot 2017-03-23 at 5.11.26 PM.png
    556.5 KB · Views: 33
  • Screen Shot 2017-03-23 at 5.12.04 PM.png
    Screen Shot 2017-03-23 at 5.12.04 PM.png
    424 KB · Views: 24
  • Screen Shot 2017-03-23 at 5.12.07 PM.png
    Screen Shot 2017-03-23 at 5.12.07 PM.png
    394.2 KB · Views: 32
  • Screen Shot 2017-03-23 at 5.12.14 PM.png
    Screen Shot 2017-03-23 at 5.12.14 PM.png
    500.3 KB · Views: 30
  • Screen Shot 2017-03-23 at 5.12.19 PM.png
    Screen Shot 2017-03-23 at 5.12.19 PM.png
    775.9 KB · Views: 24
Last edited:
Wow, just when I thought my state was getting on board with renewables, because we have so much wind now, they go and doing something like this...........and totally screw it up!

Texas utility proposes bizarre fixed charges for solar customers

And in basing its charge on a customer’s historical demand, Oncor is going into territory that regulators tend to forbid. Despite multiple utility requests no public utility commission in the United States has approved a demand charge on residential customers to date, as they are too complicated and result in unpredictable bills.
 
Wow, just when I thought my state was getting on board with renewables, because we have so much wind now, they go and doing something like this...........and totally screw it up!

Texas utility proposes bizarre fixed charges for solar customers
Callfornia PUC approved some fixed charges for solar customers but they amount to $10 per month, In California our bills are based on two aspects, transmission/distribution and generation. The trend in California is for Counties or large groups of cities are forming CCAs to purchase electricity and have more local control over the mix and price of generation. Long term the IOUs will be evolving into distribution and transmission entities that may also provide services such as billing metering and load management communication with consumers.
 
  • Like
Reactions: Ulmo
Popping in to show a high output day.

ems_renewables.gif

RenewablesGraphKey.gif


That's large scale utility solar (and misses anything on the customer side of the utility power meters), and does not include curtailment. It includes a small amount of non-solar panel solar, but the breakdown after midnight should say what it was. There seem to be telltale signs of curtailment there at the peaks; I wouldn't be surprised if there's an industry effort to try to avoid going over 10GW for as long as possible, because that is a nice round number (10^10W) that they are probably scared will hit news stands and give people optimism for solar power and want to install even more.

Subtracting about half a GW for the weird kinds of solar, that's about 9.5GW.

If the daily use is actually greater in the middle of the day and sort of follows the hump lines of the pre- and post-solar curves up to 30GW (where the net green line departs the blue line), then about 5GW were supplied by customer side solar, and since it's estimated to be about 50% of utility solar, 5GW is about 50% of 9.5GW, so that makes sense (15GW/30GW=50%, meaning almost 50% of peak mid day demand served by solar panels). (At the end of the day, the total is about 15% utility and 18% total electricity daily supplied by solar panels, give or take, depending on actual sun and use.) Did I get this wrong with the mid-day peak? Is it not actually that much demand?

duck.gif

NetDemandKey.png
 
Last edited:
Popping in to show a high output day.

View attachment 220268
View attachment 220269

That's large scale utility solar (and misses anything on the customer side of the utility power meters), and does not include curtailment. It includes a small amount of non-solar panel solar, but the breakdown after midnight should say what it was. There seem to be telltale signs of curtailment there at the peaks; I wouldn't be surprised if there's an industry effort to try to avoid going over 10GW for as long as possible, because that is a nice round number (10^10W) that they are probably scared will hit news stands and give people optimism for solar power and want to install even more.

Subtracting about half a GW for the weird kinds of solar, that's about 9.5GW.

If the daily use is actually greater in the middle of the day and sort of follows the hump lines of the pre- and post-solar curves up to 30GW (where the net green line departs the blue line), then about 5GW were supplied by customer side solar, and since it's estimated to be about 50% of utility solar, 5GW is about 50% of 9.5GW, so that makes sense (15GW/30GW=50%, meaning almost 50% of peak mid day demand served by solar panels). (At the end of the day, the total is about 15% utility and 18% total electricity daily supplied by solar panels, give or take, depending on actual sun and use.) Did I get this wrong with the mid-day peak? Is it not actually that much demand?

View attachment 220270
View attachment 220271

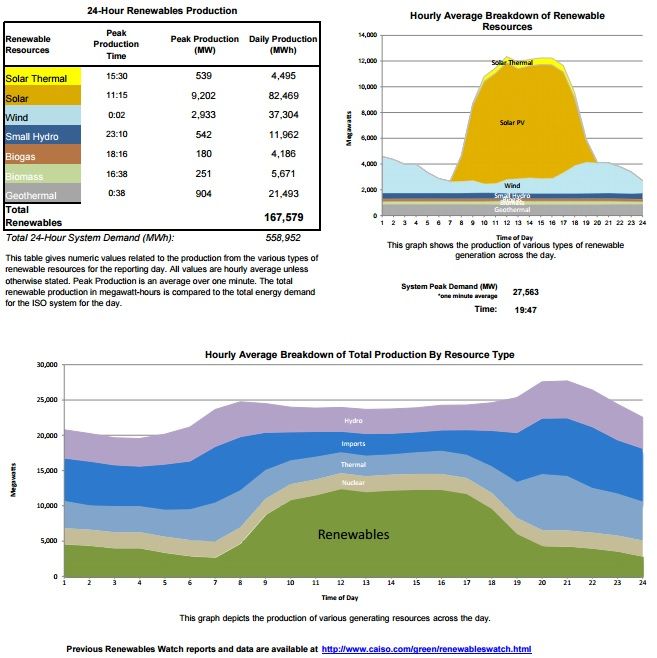
A big output day indeed 3-28-17. Max peak SPV power hit 9,202MW. The previous high was 8,911 back on 3-20-17. It first hit 8,000 on 2-24-17. March so far is a good month for solar and renewables. As of 3-28, for the month, we are at SPV is 11.96% of total power, and renewables are at 25.56%.

In January, renewables stood at 17.19% for the month. Based on the current trend, they will never drop below 20% again in the months going forward. Might even set the floor at 25%...

DailyWatch_zps0od3zaxi.jpg