Welcome to Tesla Motors Club
Discuss Tesla's Model S, Model 3, Model X, Model Y, Cybertruck, Roadster and More.
Register

Solar PV News

This site may earn commission on affiliate links.
May 2023 numbers added to UK Solar photovoltaics deployment

60.2MW, all in systems <= 50kw, 79.5% <= 10kW. Higher than May 2022 (43.0MW), and higher than April 2023 (56.2), but lower than the recent peak earlier months. Maybe past the peak but still steady business..

In the past 12 months 910.9MW installed, 728.2MW <= 50kW, 593.9MW domestic. 12mo was below 500MW through September 2022.

It looks like some data adjusted upwards as it appears that some larger solar farms opened in earlier months of 2023 and I hadn't included those.

UK MonthJanFebMarAprMayJunJulAugSepOctNovDec
202112.614.4133.117.124.317.619.51928.42327.620.4
202270.627.637.441.249.242.646.448.857.380.665.590.3
202389.5156.7102.270.760.2

UK <= 50kWJanFebMarAprMayJunJulAugSepOctNovDec
202112.612.818.1171717.617.618.121.619.925.917.9
202222.427.637.4364342.643.948.857.357.665.550.3
202369.67586.770.760.2
 
  • Like
Reactions: mspohr

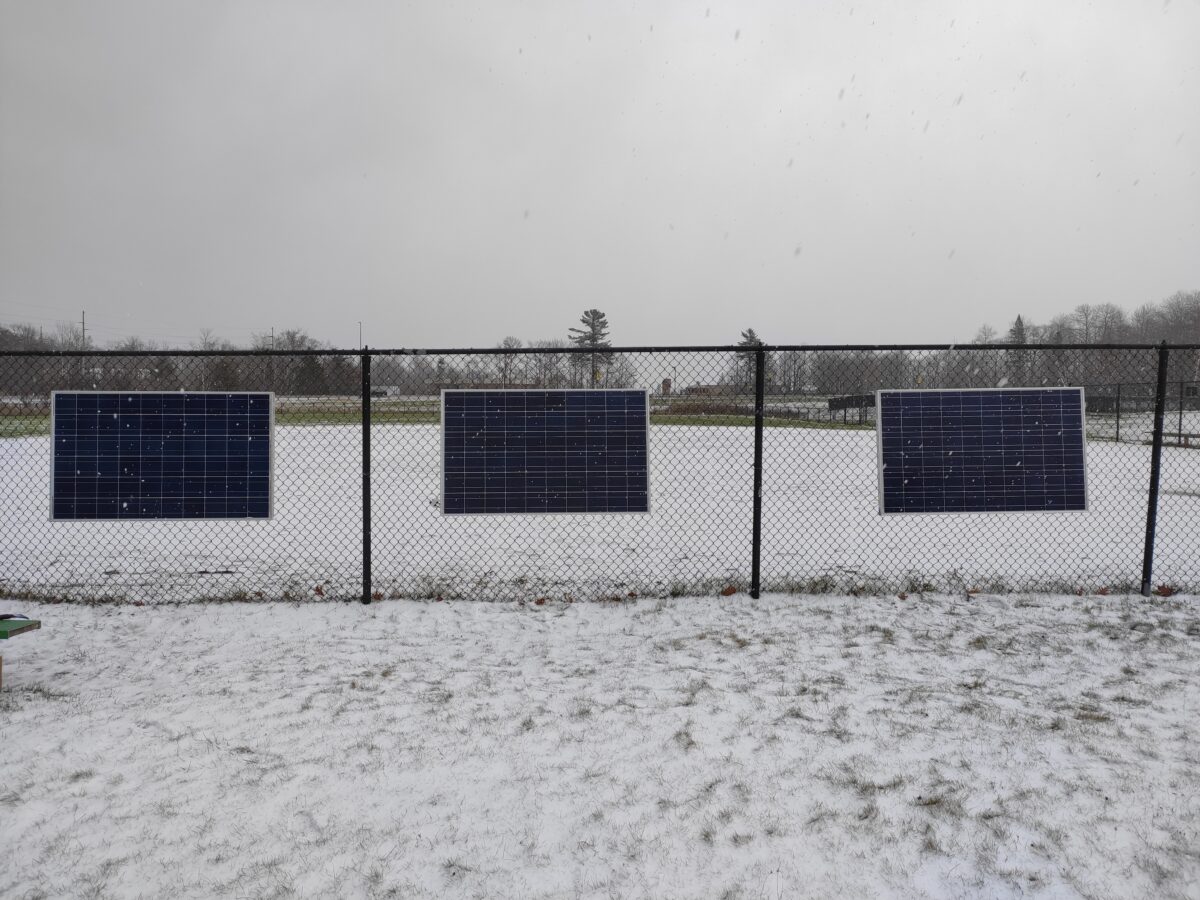
scientists presented their findings in the paper “The potential for fencing to be used as low-cost solar photovoltaic racking,” published in Solar Energy. “Future work is necessary to determine the full scope of the benefits of this approach of vertical PV agricultural fencing on a global scale,” they said, looking forward to how to improve the proposed methodology.
 
As a mechanical engineer, I don't understand the desire to mount the module only to the chain link portion of the fence and ignore the bar across the top of the fence. Two longer stainless zip ties looped over the top bar securing the top of the module and two shorter stainless zip ties securing the bottom of the module to the chain link makes a lot more sense to me. Of course, this is based on the pictures in the story, not the actual research paper described.
 
As a mechanical engineer, I don't understand the desire to mount the module only to the chain link portion of the fence and ignore the bar across the top of the fence. Two longer stainless zip ties looped over the top bar securing the top of the module and two shorter stainless zip ties securing the bottom of the module to the chain link makes a lot more sense to me. Of course, this is based on the pictures in the story, not the actual research paper described.
I agree. I also think it would be best to center the panels on the upright posts rather than between them.
However, as you point out, that is just a picture and not the research that they did (which recommends a wind load calculation).
Where I live, we have a lot of snow loading in winter and this is problematic. I'm thinking of rebuilding some of my arrays to be vertical to avoid the snow load.
 
June 2023 numbers added to UK Solar photovoltaics deployment

80.4MW, all in systems <= 50kW, 77.4% <= 10kW. Higher than June 2022 (42.6MW), and higher than May 2023 (60.2). 2nd highest total for <= 50kW since the rush to beat the end of the FITs in March 2019. Growth is continuing.

In the past 12 months 952.4MW installed, 769.7MW <= 50kW, 624.5MW domestic. 12mo was below 500MW through September 2022.


UK MonthJanFebMarAprMayJunJulAugSepOctNovDec
202112.614.4133.117.124.317.619.51928.42327.620.4
202270.627.637.441.249.242.646.448.857.380.665.590.3
202389.5156.7102.270.760.284.0

UK <= 50kWJanFebMarAprMayJunJulAugSepOctNovDec
202112.612.818.1171717.617.618.121.619.925.917.9
202222.427.637.4364342.643.948.857.357.665.550.3
202369.67586.770.760.284.0
 
  • Informative
Reactions: mspohr

Novel high transparency solar PV windows of several different design configurations were deployed over a greenhouse building envelope and field tested to investigate their energy harvesting trends and performance potential. Window integrated PV was designed to employ 3D-structured custom shaped PV modules placed around window perimeter areas, also containing embedded glass-based luminescent solar concentrator panels and spectrally selective optical coatings.

The company’s technology allows the spectrum of sunlight essential to photosynthesis in plants to pass through largely unimpeded. The photovoltaic function of the windows is tailored to rely on wavelengths that are not critical to growing crops. “Infrared and ultraviolet rays are filtered using a spectrally selective film and dispersed towards solar cells by a nanoparticle PVB interlayer,” the company says.
 
  • Informative
Reactions: iPlug
July 2023 numbers added to UK Solar photovoltaics deployment

71.3MW, all in systems <= 50kW, 77.8% <= 10kW. Higher than July 2022 (46.4MW), although lower than June 2023 (84.0). 3rd highest total for <= 50kW since the rush to beat the end of the FITs in March 2019. So growth is continuing.

In the past 12 months 977.3MW installed, 797.1MW <= 50kW, 644.7MW domestic. 12mo was below 500MW through September 2022.

UK MonthJanFebMarAprMayJunJulAugSepOctNovDec
202112.614.4133.117.124.317.619.51928.42327.620.4
202270.627.637.441.249.242.646.448.857.380.665.590.3
202389.5156.7102.270.760.284.071.3

UK <= 50kWJanFebMarAprMayJunJulAugSepOctNovDec
202112.612.818.1171717.617.618.121.619.925.917.9
202222.427.637.4364342.643.948.857.357.665.550.3
202369.67586.770.760.284.071.3
 
  • Like
  • Informative
Reactions: dhrivnak and mspohr
August 2023 numbers added to UK Solar photovoltaics deployment

72.5MW, all in systems <= 50kW, 80.6% <= 10kW. Higher than August 2022 (48.8MW), although lower than recent peak June 2023 (84.0). 3rd highest total for <= 50kW since the rush to beat the end of the FITs in March 2019. So growth is continuing.

In the past 12 months 1,000.9MW installed! 820.7MW <= 50kW, 660.6MW domestic. 12mo was below 500MW through September 2022.

UK MonthJanFebMarAprMayJunJulAugSepOctNovDec
202112.614.4133.117.124.317.619.51928.42327.620.4
202270.627.637.441.249.242.646.448.857.380.665.590.3
202389.5156.7102.270.760.284.071.372.5

UK <= 50kWJanFebMarAprMayJunJulAugSepOctNovDec
202112.612.818.1171717.617.618.121.619.925.917.9
202222.427.637.4364342.643.948.857.357.665.550.3
202369.67586.770.760.284.071.372.5
 
  • Like
Reactions: dhrivnak and mspohr

However, much of the organized opposition to rural solar development has focused on the issue of farmland conversion.

Over the next 10 years, U.S. solar energy output is expected to increase five-fold, helping to address climate change and bring clean and affordable energy to more communities,” SEIA noted in an embargoed press release shared with CleanTechnica by email. “The rapid increase in utility-scale solar also means that the industry must address various issues, including agricultural land conversion, wildlife and habitat impacts, and community engagement.” “The Solar Uncommon Dialogue agreement stresses that the development of large solar projects must be transparent, equitable and efficient and acknowledges that this will require many trade-offs.”

The reliance on diesel-powered equipment, the rise of energy sucking factory-type livestock operations, the copious use of plastic in modern farming, and in particular, the growth of the energy crop industry further undercut the argument that farmland should be broadly immune to solar development. Also pounding a nail in the coffin of the anti-solar argument is the emerging field of agrivoltaics, which deploys solar panels to coexist with grazing lands, pollinator habitats, and human food crops, enabling farmers to continue working the land while also realizing income from the solar array.
 

Scientists suggest that the world has reached a crucial juncture in energy usage patterns, indicating that solar power is poised to become the predominant energy source by the middle of this century. However, the transition is fraught with challenges that need immediate attention. Solar power reaches tipping point The research, collaboratively conducted by teams from the University of Exeter and University College London, presents compelling evidence that solar photovoltaics (PV) are on track to dominate the global energy mix. This monumental shift, experts argue, is feasible without relying solely on more aggressive climate policies.
The study’s confidence in solar energy stems from an innovative model that captures the dynamic relationship between technology deployment and cost reductions, recognizing the virtuous cycle propelling the rapid growth of solar power.

The study culminates in a call to action for policy-makers. By focusing on these four critical areas, governments can accelerate the shift towards a solar-dominated energy landscape. This involves proactive engagement with grid adaptation strategies, equitable financial structures, sustainable resource management, and socio-political considerations.
 
"........between 2015 and 2023 the number of solar panels built around the world increased by more than 400%, electric car sales increased by nearly 2,000%, residential heat pump sales increased by 225%, and battery storage capacity additions increased by 2,500%.

Of all the solar panels installed in the history of human civilization, close to one-third were deployed in just the past two years. Similarly, about 60% of all electric car sales and 60% of energy storage battery installations — ever — occurred in the same period. These technologies are key to achieving net zero climate pollution by 2050.

chart showing global installations of selected clean energy technologies, 2010-2022
Exponential growth in the deployment of solar panels, electric cars, residential heat pumps, and battery storage. Source: 2023 IEA Net Zero Roadmap.
 
September 2023 numbers added to UK Solar photovoltaics deployment

71.7MW, with a 1MW adjustment from old systems, and otherwise all in systems <= 50kW, 75.6% <= 10kW. Higher than September 2022 (57.3MW), although lower than recent peak June 2023 (84.0). Joint 5th highest total for <= 50kW since the rush to beat the end of the FITs in March 2019. So growth is continuing.

In the past 12 months 1,068.1MW installed! 834.1MW <= 50kW, 666.3MW domestic. 12mo was below 500MW through September 2022.

UK MonthJanFebMarAprMayJunJulAugSepOctNovDec
202112.614.4133.117.124.317.619.51928.42327.620.4
202270.627.637.441.249.242.646.448.857.380.665.590.3
202389.5156.7102.270.760.284.071.372.571.7

UK <= 50kWJanFebMarAprMayJunJulAugSepOctNovDec
202112.612.818.1171717.617.618.121.619.925.917.9
202222.427.637.4364342.643.948.857.357.665.550.3
202369.67586.770.760.284.071.372.570.7
 
  • Like
Reactions: iPlug and mspohr

The US Energy Information Administration (EIA) expects annual solar generation to surpass annual hydropower generation in 2024 for the first time. The EIA’s “Short-Term Energy Outlook,” released today, forecasts that the US will generate 14% more solar electricity than hydropower in 2024. That’s based on continued growth in new utility-scale and small-scale (e.g., rooftop) solar.
 
  • Like
Reactions: ggies07 and iPlug

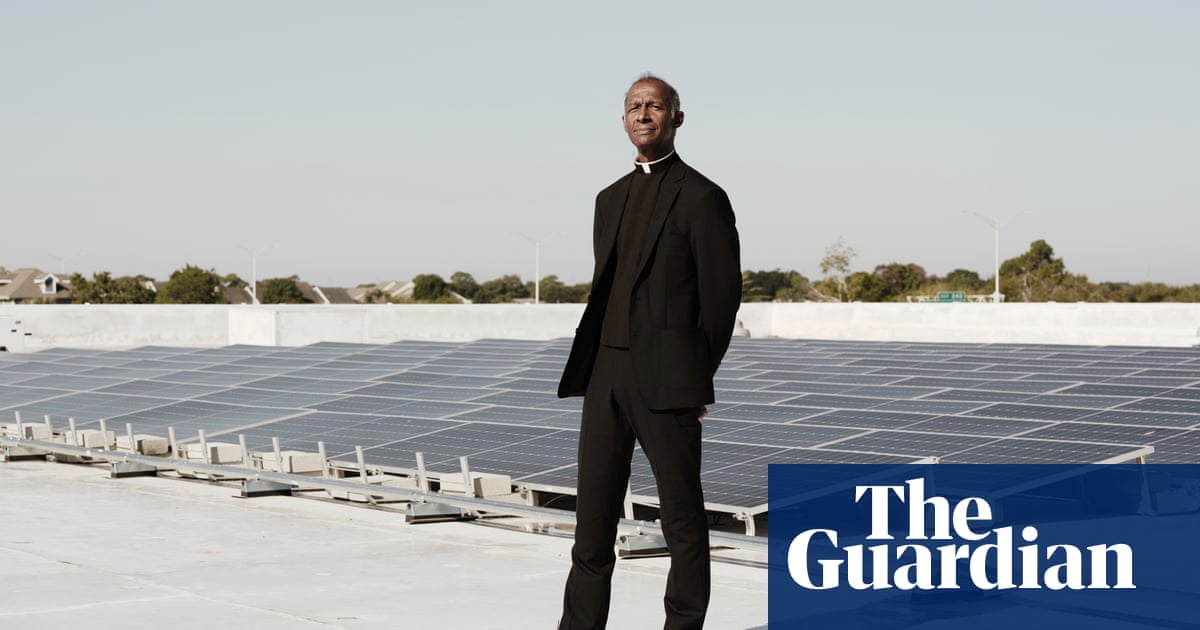
The fix, they decided, would be the community lighthouse network, solar-powered disaster response hubs that could transform the city’s approach to resilience for climate and other natural disasters.

In a worst-case scenario – no sun, thundery dark skies and power outage – the backup batteries could power essential appliances for a couple of days including the water heater, five commercial fridge freezers storing perishables for the weekly food pantry, and air conditioning for the vast main hall which could be converted into a dormitory-style shelter. But on this brilliant cloudless morning, most of the solar-generated energy was going into the city’s electric grid. New Orleans’ one-for-one net metering scheme allows the church to offset its excess clean energy against the utility’s dirty energy, and this should become a net zero facility within 12 months.
 

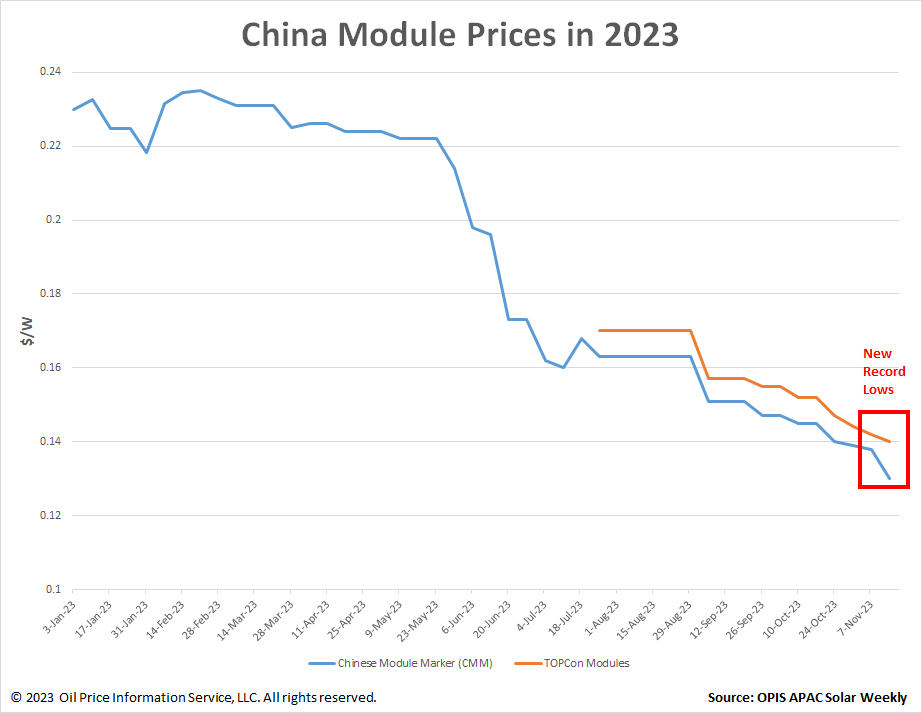
The Chinese Module Marker (CMM), which is the OPIS benchmark for mono PERC modules from China, and TOPCon module prices hit another historical low this week falling $0.008 per Watt peak (wp) and $0.002/wp to $0.130 and $0.140/wp respectively, according to OPIS data. Weak market sentiment and lackluster export demand continue to weigh on the module segment.
 

St Mary’s Gardens is one of more than 100 projects in California that have had solar panels installed as part of the state-funded Solar on Multi-Family Affordable Housing (Somah) program. The state is allotting $100m a year in public funding starting in July 2019. By 2030, the program’s goal is to power 300 megawatts through new solar projects on low-income rental buildings across the state – akin to the amount of electricity generated by a small nuclear power plant, or enough to provide power to 150,000 tenant families.
 
October 2023 numbers added to UK Solar photovoltaics deployment

62.8MW, all in systems <= 50kW, 79.5% <= 10kW. Lower than October 2022 (80.6MW) total but higher in systems <= 50kW. So growth is continuing.

In the past 12 months 1,050.3MW installed. 839.3MW <= 50kW, 666.2MW domestic. 12mo was below 500MW through September 2022.

UK MonthJanFebMarAprMayJunJulAugSepOctNovDec
202112.614.4133.117.124.317.619.51928.42327.620.4
202270.627.637.441.249.242.646.448.857.380.665.590.3
202389.5156.7102.270.760.2136.771.372.571.762.8

UK <= 50kWJanFebMarAprMayJunJulAugSepOctNovDec
202112.612.818.1171717.617.618.121.619.925.917.9
202222.427.637.4364342.643.948.857.357.665.550.3
202369.67586.770.760.28471.372.570.762.8
 
  • Informative
Reactions: mspohr
October 2023 numbers added to UK Solar photovoltaics deployment

62.8MW, all in systems <= 50kW, 79.5% <= 10kW. Lower than October 2022 (80.6MW) total but higher in systems <= 50kW. So growth is continuing.

In the past 12 months 1,050.3MW installed. 839.3MW <= 50kW, 666.2MW domestic. 12mo was below 500MW through September 2022.

UK MonthJanFebMarAprMayJunJulAugSepOctNovDec
202112.614.4133.117.124.317.619.51928.42327.620.4
202270.627.637.441.249.242.646.448.857.380.665.590.3
202389.5156.7102.270.760.2136.771.372.571.762.8

UK <= 50kWJanFebMarAprMayJunJulAugSepOctNovDec
202112.612.818.1171717.617.618.121.619.925.917.9
202222.427.637.4364342.643.948.857.357.665.550.3
202369.67586.770.760.28471.372.570.762.8

1701394693243.png

Possibly trending back down as UK electricity prices ease and some of the installation prices increase.
 

The Solar Energy Industries Association (SEIA) and Wood Mackenzie released their latest report, “US Solar Market Insight Q4 2023,” in which they report that third-quarter (Q3) additions of new solar totaled 6.5 gigawatts (GW) – a 35% year-over-year increase – as federal clean energy policies begin to take hold. California and Texas led the US for new solar installations in Q3, and Indiana ranked third with 663 megawatts (MW) of new capacity as several large utility-scale projects came online. Fourteen states and Puerto Rico installed more than 100 MW of new solar capacity in Q3. While economic challenges are beginning to impact the solar and storage industry, solar is still expected to be the largest source of generating capacity on the US grid by 2050.