The 85D has two 220hp motors, what does the 70D have? Are they the same motors as the 85D but tuned lower? Apologies if already discussed.
Yes it is. See this picture:


You can install our site as a web app on your iOS device by utilizing the Add to Home Screen feature in Safari. Please see this thread for more details on this.
Note: This feature may not be available in some browsers.
The 85D has two 220hp motors, what does the 70D have? Are they the same motors as the 85D but tuned lower? Apologies if already discussed.
What's quite evident is that 30-60 or 40-80 the P85D is quite a bit slower than cars that are on paper comparable. I got easily outaccelerated by a 911 Turbo S going from 30 to 60 - wasn't even close.

So I don't know where you get the EPA number of 305 from
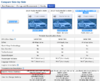
From the EPA website:
Compare Side-by-Side
View attachment 77475View attachment 77476
So you can see that according to the EPA it is:
70D: 330wh/mi
85D: 340wh/mi
60: 350wh/mi
P85D: 360wh/mi
85: 380wh/mi
What doesn't make sense to me is how the P85D is somehow *more* efficient than the 85, yet it gets lower mileage???
Clearly their numbers are either A: accounting for some kind of loss in charging. B: totally made up??? C: Someone made a typo on the P85D (seriously it is the only one that doesn't make any lick of sense)
Anyway, throwing out the P85D because something just isn't adding up there, you can see that the efficiency difference based on EPA numbers is 8% for the 85->60 (380 -> 350) (obviously weight savings gives you the 8%) and from the 85D -> 70D (340 -> 330) is 3% efficiency gain. So based just on the numbers posted by the EPA, and assuming that whatever charging inefficiency they are hitting you on here is equal across all cars (which might not actually be the case I admit that) I am actually on the side that says it isn't being contributed to some kind of weight savings.
That doesn't necessarily mean they aren't better cells. For all we know, they have either A: Been using better cells for a while now across all cars, or B: the better cells didn't improve the weight and in fact made the cells heavier, they just fit more power in a smaller package (which is somewhat important all by itself, more power but increased weight, same volume, and if they are *cheaper*??? why wouldn't you use them?). In any case 3% for a 10kWh drop vs 8% for a 25kWh drop any minor non-matchup here is likely attributed to the more efficient motors than anything.
- - - Updated - - -
If 8% is equally dropping per pound then going from 60 to 85 cost them 1% per 3.125kWh. Similarly in going from the 70D to 85D it cost them 1% per 5kWh.
Is the Dual Motors really that much more efficient that the added weight doesn't make as large of an impact to efficiency?
Let's look at a different comparison to find out. 85 vs 85D. This is 380 -> 340 which is an efficiency gain of 11%!!! With a smaller motor in the back to make up for a small motor in front, I would bet that there isn't too much weight difference between the two. Even if there was, that is still 11% being gained *straight* from adding the dual motor. I am willing to believe that 1% efficiency loss per 5kWh number up above as the motors are making the car more efficient in a big way, in-spite of the weight difference.
I believe that the EPA Wh/mile numbers are the "derived" from actual test data with some kind of multipliers and therefore did not want to use them.
The EPA range miles, however, are obtained based on test data, so I calculated Wh/mile using EPA range numbers and usable capacity of the battery (capacity - "bricking" reserve), as was shown in my original post.
The chart below, perhaps, will better illustrate what I was trying to explain.
The chart shows four points corresponding to the various Wh/mile that I calculated in my original post:
60 --> 274 Wh/mile
85 --> 305 Wh/mile
85D --> 299 Wh/mile
70D --> 277 Wh/mile
Step 1. Consider the progress from point 274 (60) to 305 (85): as battery cells added to the pack the battery capacity goes up from 60 kWh to 85 kWh, and energy consumption increases from 274 Wh/mile to 305Wh/mile due to increasing weight of the pack.
Step 2. Consider the progress from point 305 (85) to 299 (85D): as dual motor drive is added the energy consumption goes down from 305 Wh/mile to 299 Wh/mile due to optimized blending of two motors.
Step 3. The resultant line in blue (Step 1 + Step 2) represent combined effect of the increased weight due to added cells and dual motor drive on the energy consumption. What I was trying to explain in my original post is that energy consumption for 70D, if additional 10kW capacity would be added by adding cells to the battery pack similar to 85 variants, would be located on or very close to the blue line. As chart, however, shows 70D energy consumption is significantly lower than the corresponding point on the blue line. It is actually very close to the energy consumption for S60. This implies that the additional 10kW of battery capacity did not add appreciable weight to the pack. This giving credence to my theory that additional 10kW capacity was not obtained by adding cells to the pack, but keeping the same quantity of cells, but using 16.7% higher energy density cells, the same quantity of them as in the original 60 kWh pack.
View attachment 77501
I think your chart might be connecting the wrong dots. You have drawn a line from smallest pack and less efficient single motor, to largest pack and more efficient dual motors. If you connected the two RWD points and the two AWD points, I think you would have nearly parallel lines whose values track well with pack weight.
BTW, when attributing Wh/mi differences strictly to pack weight because presumably two small motors weigh about the same as one large one, you also have to consider the extra weight for AWD of a second reduction gear, front drive axles and articulated linkages to enable powered front wheels to steer.
Or am I missing something?
I most definitely do - try to read my post again.
In the second part of the post I am suggesting to draw a line from the point indicating energy consumption per mile for 60 to the point indicating energy consumption for 85D (the fact that this point is for D variant accounts for dual motor setup). Both of these points should be drawn on a Wh/mile vs. kWh chart. So the difference between energy consumption of 60 and 85D is due to adding cells (and weight) to go from 60kWh to 85 kWh battery pack **and** adding dual motor drive.
If battery pack of 70D is obtained just by adding additional cells, like it is done for 85D, the efficiency for 70D should be located on or close to above line. The efficiency of 70D, however, is essentially the same as 60, indicating that 70D and 60 battery weight is very similar, which is possible only if additional 10kW of capacity in 70D are obtained using the same quantity of cells, each of which have weight similar to cells in 60, but 16.7% higher volumetric energy density.
No. You have me draw a line between two points where two variables change (size of battery and single versus dual motor). You can't linearly interpolate for the second variable which is what you suggest we do. Besides, the Wh/mile curve should be parabolic. Add some generic weight savings anywhere but the battery because the EPA for the 70D model is measured on the latest release versus an earlier release for the 60 and there you have it. The point is exactly where we should expect it.
Because reserve is not there for other consumers to keep on working while the car is stranded but for the voltage not to drop too low too quick.First, why would it be a percentage in reserve?
These maximum and minimum battery voltages have already changed a few times.
Of course we're all just theorizing about what is happening inside the battery pack, but it's fun. Lets see 85 kwh X 1.167 =99.2 kwh. Pretty close to that magic 100 kwh mark. Just sayin...This giving credence to my theory that additional 10kW capacity was not obtained by adding cells to the pack, but keeping the same quantity of cells, but using 16.7% higher energy density cells, the same quantity of them as in the original 60 kWh pack.
Yes, I do: estimated range changes after FW update.Do you have any evidence for this statement?
Yes, I do: estimated range changes after FW update.
There are a ton of factors that go into the estimated range. I would not consider those "evidence" that the boundary voltages (on either end) have been changed.Yes, I do: estimated range changes after FW update.
Doesn't work like this. The Model S is traction limited at low speeds, so power increases linearly until peak output where it stays mostly linear until it drops at higher speeds.the 0-60 calculator is based on evidence with gas cars. As we all know gas cars are outrageously inefficient compared to electrics.
Look at this : (2238kg*(60mph*0.447)sq)/2/3.1s=257kW So P85D uses an average of 257kW during its acelleration to 60mph. The peak power is of course higher at some point. Can some math savvy person tell us based on the acceleration curve what that power is? That would be the answer to the lingering question.
Interesting. I was wondering if Tesla might replace the old 85 kWh packs from all of the returned S85, P85, P+85 when people upgraded to the 85D. If those old packs had "degraded" by 10-15%, they would be in the 70D range. Tesla could put new batteries in the 85 kWh CPO's, put the old packs into the 70D's and nobody would know that they had degraded. It's probably not legal to put "used" parts into a new vehicle, so just speculation and definitely not an accusation.I noticed on the specs tab that the S70D is listed as having both 85 kWh and 70 kWh battery packs.
Doesn't work like this. The Model S is traction limited at low speeds, so power increases linearly until peak output where it stays mostly linear until it drops at higher speeds.
View attachment 77577
(theoretical+dyno graphs from TMC user WarpedOne)
No. You have me draw a line between two points where two variables change (size of battery and single versus dual motor). You can't linearly interpolate for the second variable which is what you suggest we do. Besides, the Wh/mile curve should be parabolic. Add some generic weight savings anywhere but the battery because the EPA for the 70D model is measured on the latest release versus an earlier release for the 60 and there you have it. The point is exactly where we should expect it.