Welcome to Tesla Motors Club
Discuss Tesla's Model S, Model 3, Model X, Model Y, Cybertruck, Roadster and More.
Register

The demise of the OEMs

This site may earn commission on affiliate links.
I have a noob question. Is there anyone keeping track of total global deliveries/sales per car manufacturer and comparing that to Tesla? This would be a very stunning graph to follow in the coming decade, seeing Tesla rise from zero to hero.

I looked around on the internet but I find fragmented data and it is also hard to account for mergers (Stellantis for example).

I went back as far as 2017 and this is what I currently came up with:
View attachment 850227

The data behind this:

Company/Year20172018201920202021
BMW2.030.331,002.494.276,002.520.146,002.324.778,002.521.596,00
Changan1.759.971,002.003.663,002.314.547,00
Ford5.953.122,005.734.217,005.385.972,004.231.549,003.942.755,00
Geely1.245.055,001.500.458,001.361.556,001.320.471,001.328.029,00
General Motors8.787.233,007.724.163,006.833.592,006.294.385,00
Honda4.967.689,005.265.892,005.323.319,004.790.438,004.456.728,00
Hyundai Kia3.951.176,007.437.209,007.189.893,006.353.514,006.668.037,00
Maruti Suzuki2.891.415,003.212.984,001.563.297,001.457.861,001.652.653,00
Mazda1.495.557,001.631.142,001.454.121,001.243.039,001.074.987,00
Mercedes2.093.476,002.310.185,002.339.024,002.164.275,002.093.476,00
Nissan4.834.694,005.653.743,005.176.211,004.029.174,004.064.999,00
Renault2.275.227,003.883.987,003.749.815,002.949.871,002.689.454,00
Stellantis8.091.825,006.205.996,006.142.200,00
Tesla103.100,00245.200,00367.500,00499.550,00936.172,00
Toyota7.843.423,0010.521.134,0010.741.556,009.528.753,009.562.783,00
Volkswagen9.667.535,0010.831.232,0010.975.352,009.305.427,008.882.346,00


Before I delve deeper to go back to 2012 or I merge previous companies' delivery data (Stellantis for example) I'd like to ask if this is being recorded by anyone or if there is an internet resource for this. I had to combine this from very fragmented data. (It's a first quick draft using numbers from third party websites. If I were to double down I should go to the Investor Relations pages of each company but I don't need that amount of detail IMO).

Either way, if nothing is out there, I'm planning on adding future values to my existing data since the future data will be way more interesting for us TSLA investors then past data (= Tesla hugging the x-axis whilst the rest does whatever above it).

Thanks in advance for insight/links and/or data!
It'd help if you ordered your legend by 2021 sales. So Toyota on top then VW then Hyundai/Kia, GM and Stellantis. Otherwise it's hard to track down which blue-ish line matches which OEM. Your legend also needs to include Tesla a couple more times, ha.

These guys list the top 15 OEMs each year. I don't know how they handle China's JV manufacturers. Like you, they keep Nissan/Renault/Mitsubishi separate. Those who combine the three show them in 3rd place, ahead of Hyundai/Kia.

You mentioned BYD -- they were below Tesla last year at ~600k but will beat them this year. They plan to sell 4m cars (all EV) in 2023 which could vault them as high as 6th place. Get them on your chart now and beat the Christmas rush :)
 
  • Helpful
Reactions: jeewee3000
Thanks a bunch. Will dig up your posts when I have some free time.

I understand the tendency to split up the data according to fuel type/PHEV/BEV/... but this data shows the (to me obvious) fact that ICE vehicle sales are in decline and EV sales are increasing.

The chart I'm also interested in, is an aggregate of all cars manufactured by a certain company/group (i.e. "the legacy OEMs") since I expect their sales to drop massively by 2030 whilst Tesla and for example BYD or another Chinese EV company become king of the charts.

In other words, I want to see the current "behemoths" become ghosts of their past selves in a nice chart to put on my wall :).
@jeewee3000
perhaps you might consider a number of variables to graph, say gigawatt hours of battery capacity as one variable, just a thought

I always loved Minard's graph of Napoleons disasterous march to Moscow, and back, where he graphs 7 variables that say, at least to me, "If you go to Zha-ha-doom, you will die" don't invade Russia in the winter, very bad idea, you will die

 
  • Informative
Reactions: UkNorthampton
1666698268835.png
 
  • Informative
Reactions: petit_bateau
Good visualization of the existing situation at the end of 2021, delusional projection of the future.


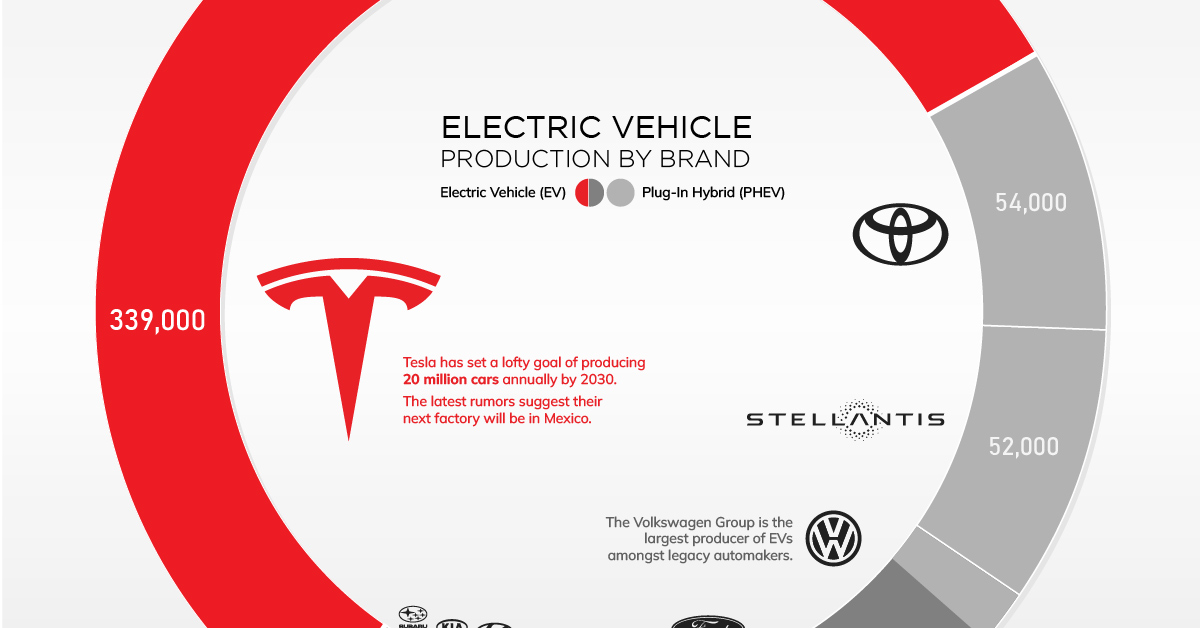
12sukm0ial7a1.jpg
This chart looks completely screwed up. 2021 model year is very stale, they've been selling 2023s for months. Also, it says "production" but appears to show sales data. To my knowledge VW Group produced no 2021 EVs in the US and Ford produced very few (Mach E is made in Mexico and the first Lightnings were 2022s).

2022 calendar year sales numbers would be more useful. Tesla should be a bit over 500k. Ford is a distant 2nd at ~60k BEVs plus some Escape PHEVs. VW Group is below the levels shown in this chart, at ~40k BEVs plus some PHEVs. Toyota/Lexus is also down, figure 30-35k PHEVs plus a handful of bz4x things. GM may hit 40k, almost all Bolts. I don't know about Stellantis.
 
  • Like
Reactions: petit_bateau
With the price points I see, everything qualifies.

A M3 rear wheel drive can be had for 36.5 K after tax credit.

Talk about declaring war on the OEMs.

What is their response?

I think there is some huddling in a corner and crying. A lot of that I imagine.

I wonder how the Tesla-nevers are going to cope with paying $20,000 more for a Cadilac that charges slower and burns 25% more power?

This is such a freaking huge flex on the industry.

As with almost all Tesla moves, in hindsight it was so obvious.

With the never ending multiple month long waits, the only thing they could do was raise prices.

Now with the queues all cleared, inventory building and the factories ramped to where operating leverage can kick in a big way, they slash prices into a declining car market hard and preemptively. And I do mean slash. The 7.5 K from the Feds is all whipped cream at these price points.

I don’t know where their margins are here, but I know they are still positive and possibly still industry leading.

Now comes the new Giga.

The OEMs cannot spend enough on advertising and MM bribing to counteract this. They are so f#*&ed.

Have no idea what this mean for the SP tomorrow, but I think it is incredibly bullish for the future.

Legacy auto is screwed. ICE price advantage is gone before they’ve ramped their BEV lines. Model Y was already on track to be the best selling car in the world, now it’s pretty much guaranteed.

Astonishing price cuts all at once. I will definitely need to revise my 2023 earning model. Still looking good but not as bullish on automotive. On the other hand this might indicate that cost deflation is happening faster than I modeled for. COGS per vehicle in Q3 was $39.2k, which was 10% higher than the 2021 average of $35.6k, and even that average had extremely high shipping costs, expedite fees, and chip costs compared to a normal year. Also the new factories are coming into volume production and Tesla likely has a clearer understanding of cost at Berlin and Austin now. Hard to distinguish how much is due to a decline in demand vs an increase in supply.

@Todd Burch is right that some people will take advantage of the lower prices to buy extras, or to upgrade to more expensive variants, so a simple subtraction of the price drops from margins is likely too pessimistic.

Remember that $45/kWh battery credits are going to add an easy $3-4k back into margin this year for North American sales.

The biggest cuts were for Y, S and X which were earning well over 40% margin at the previous prices. Y matters most and it was basically earning about $29k per car if $68k average price and $39k average cost, and that was not even counting cost improvements in Texas and the battery subsidy. If 2023 Y ASP in the US is now going to be ~$55k and cost is going to $36k with deflation and Texas efficiency, profit per car is still going to be 55-36+3 = $22k for 40% gross margin. Both of these numbers are substantially better than Tesla’s global average vehicle profitability has ever been. This matters because Y will comprise the majority of sales volume for Tesla next year. Growth of Y production at the new factories plus hopefully a full year of smooth sailing at Shanghai remains the big story for 2023. Another equivalently huge price cut would be needed to reduce average automotive margin below 20%.

What a power move though. I don’t see how anyone can compete with this.

It's a dramatic move for certain, BUT it is the only way the 3 & Y could qualify for the messed up IRA qualifications. Tesla just threw down a massive gauntlet on the OEMs.

By this point I'm sure Ford and GM wish the IRA had listed the Y5 as an SUV and allowed the 3 to qaulify, because NOW Tesla cars are priced to utterly decimate the competition. This will hurt margins for Tesla, but it's going to hurt much more for Ford, GM, and every other automaker.

To me it feels like this is the right path. If they do nothing but protect margin, growth will stagnate with the rest of the industry. Compress margins and get the scaling to the stratosphere, margins will then catch up. This will utterly kill competitors.

I have no idea. But I have confidence that Tesla is playing this right. And I think people underestimate how much economies of scale can impact production cost.

Remember a week ago when Tesla cut prices in China and everyone here freaked out about the stock, then it went up the next day?

Margins have been huge, with huge growth, and the stock still got pummeled.

Tesla energy is ramping too. That will start making a bigger difference with each quarter, and Tesla Energy (with significantly growing margins) will be taking a larger perfentage of Tesla’s total revenue. That’s something most analysts have been assigning nearly zero value.

Now imagine you’re Ford or GM. How are you feeling?

Tesla’s prices might be at or below your production costs, and for a superior car. Now what do you do?

Yeap, it's gonna heavily reduce sales potential for legacies further pushing them to the brink.
 
Prices in Sweden(sek):

Model 3 SR 520k
Model 3 LR 610k
Model 3 P 680k

Model Y SR 539k
Model Y LR 629k
Model Y P 729k

BYD Atto 485k
VW ID3 487k
VW ID4 585k
VW ID5 610k
Skoda Enyaq 640k
AUDI Q4 eTron 645k
BMW iX1 640k
BMW i4 680k

(modified a post from Teslaclubsweden for readability)
 
  • Like
Reactions: petit_bateau
Tesla has managed to prevent the Model Y and Model 3 from draining off too much Model S and X demand. In fact they sell more now than ever I think.

Tesla delivered 66,705 Model S/X in 2022.

In 2017 Tesla delivered 101,312 Model S and X vehicles.

In 2018 Tesla delivered 99,394 Model S and X vehicles.

In 2019 Tesla delivered 95,200 Model S and X vehicles.

Tesla just recently started delivering refreshed S/X to Europe and China.

After the Refresh there was a very slow ramp up. Covid, chip shortages, other shortages, and Tesla focusing on Model Y ramp up too.