Welcome to Tesla Motors Club
Discuss Tesla's Model S, Model 3, Model X, Model Y, Cybertruck, Roadster and More.
Register

TSLA Technical Analysis

This site may earn commission on affiliate links.
You guys still need to follow thestockchannel. The guy explained pretty well for the past few days what is happening. He saw a double top and the S&P broke down the neckline. It's not too hard to see the roll over pattern from the hour chart. So basically a few days of down days, a few massive sell off days, then bounce off support so the stock can go higher. He noticed red days have increase in volume.

Just go watch all his videos from this week. This is just algro trading as he is not the only person with some kind of secret information.
 
Last edited:
You guys still need to follow thestockchannel. The guy explained pretty well for the past few days what is happening. He saw a double top and the stock broke down the neckline. It's not too hard to see the roll over pattern from the hour chart. So basically a few days of down days, a few massive sell off days, then bounce off support so the stock can go higher. He noticed red days have increase in volume.

Just go watch all his videos from this week. This is just algro trading as he is not the only person with some kind of secret information.

"The Stocks Channel" I assume? He seems to know his stuff, but I prefer just moaning as the stock goes down and cheering as it goes up. :D
 
"The Stocks Channel" I assume? He seems to know his stuff, but I prefer just moaning as the stock goes down and cheering as it goes up. :D
LoL I know I am not a fan of watching what he had to say about this week cause it was bearrrrrish. But the guy named the top for Tsla since last week, named the top for Appl...have us watching key support levels and Vix to make sure it doesn't go above..was it 21 or else that can signal a correction. Just all sorts of bearish take on the Spy. And then just to watch it all play out but deep down hoping that we can see a big green day to course correct but never got it this week:(.
 
  • Like
Reactions: EVMeister
Technical analysis, price predictions and news on Tesla stock for week ending 09/11/2021. Tesla has near term resistance at $762. A break above that, would set it up for a run to a major resistance level at $795. If Tesla pulls back to set itself up for the next higher low, we will find support first at the 50 and 200DMA at around $689-691. A break below that would set it up for a drop to the uptrend line that currently lies at $677. This uptrend line has held as support since May 19.

Tesla news this week includes:
  • ARK Invest confirms base case of Telsa $3,000 price per share
  • Elon Musk agrees with ARK Invest’s Tesla $3,000 price target if Tesla executes really well
  • Tesla Model Y sales soar as of September 7, 2021 in Norway
  • Tesla China sales jump in August 2021
  • Tesla rewrote its own software to survive the chip shortage
  • Tesla patent for laser windshield wipers
  • Elon Musk: FSD Beta 10 is mind-blowing
  • Elon Musk asks Tesla workers to ‘go super hardcore’ and finish the third quarter strong in a leaked email

 
Today TSLA marked its highest closing price since April 13. Following a first hour dip, it climbed upward nicely to finish near the high of the day. These provide encouragement.

TSLA remains well above its 50 & 200-day SMAs, which formed a bullish Golden Cross on August 30. Rosh Hashanah ends tomorrow evening, which often signals a resumption of buying from those who refrain during the Jewish holiday season. Then the quarterly Triple Witching expiration of options and futures comes with the close on Friday, during which anything can happen.
 
Technical analysis, price predictions and news on Tesla stock for week ending 09/18/2021. Tesla finds itself consolidating between $730 and $765. It will need to breakout above resistance at $770, after which it will likely rally into the next major resistance at $810. To the downside, we have support at $730. A break below that, and we would have support of the 50 and 200DMA which currently lie at $700 and $693 respectively.

Tesla news this week includes:
  • UBS Note Key Takeaways: $25k budget Tesla model to come in 2023; European supercharger revenue opportunity is greater than exclusivity; Impact of price increases will only be seen in Q3 and Q4

 
Below is commentary this morning from Craig Johnson, the chief market technician at Piper Sandler.

1632328427544.png
 
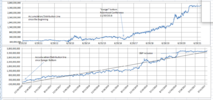
I kinda like looking at graphs, one for instance is "cumulative money flow indicator" a 'price x vol' type thingy
accumulation/distribution line.
to me, it's a confirmatory indicator.
Is the stock direction up or down overall
first ~3 years, A/D flat, finally became positive end of May 2013
next ~3.5 years, A/D more or less flat, then Ron Baron RobinHood Conferance end of Nov, 2016, an inflection point where financial "seppuku" "3 year slow apocalypse" was initiated by shorts transferring wealth (& shares) to longs,
(A very gracious thank you from my portfolio to Mark BS for alerting more "everyone's" to TSLA)

The Accumulation/Distribution Indicator (A/D) Formula

{MFM} = ( [Close - Low] - [High - Close] ) / [High - Low] * volume that trading period(day) then sum result

1632404053406.png


Stock Price Line, 20 day SMA

1632403979882.png


Closer Look
1632404128661.png


even closer look
zooming in a lot to recent activity, A/D turned up a tiny bit end of May/early June, then early August turned more upwards.
to me, it looks like a "pause" around S&P inclusion/Jan this year, than slope heading up last ~4 trading/'buy&HODL" months
(the data goes back to day 1 of trading)

(my personal lesson is if I had just HODL from my first acquisitions, I would have between 10 and 17x more shares, but i'm 'quite comfy thank you")
(perhaps my grandchildren will use their inheritance as a ticket to "Mars & Beyond")

1632401992705.png
 

Attachments

  • 1632401885584.png
    1632401885584.png
    78.3 KB · Views: 32
Technical analysis, price predictions and news on Tesla stock for week ending 09/25/2021. Tesla ends the week breaking out of a mini consolidation and pushes to higher highs. There is near term resistance at $775. A break above that would set it up for a run to $820. If it can break above $820, we will likely see it continue to rally to $870. Finally, a break above that, would set it up for a push to all time highs at around $1040-1090! To the downside, we have support at $765, then $730. A break below these levels would set it up for a drop to as low as $697-708.

Tesla news this week includes:
  • Tesla floods the Department of Motor Vehicles throughout China as Q3 registrations appear to shatter records
  • Tesla Megapack and Solar project to replace coal plant in New Mexico
  • Fourth Tesla Gigafactory location has NOT YET been decided
  • FSD Beta request button will be released this Friday, will exponentially accelerate neural net FSD learning
  • Musk: Chip shortage a short term issue, will have good capacity by next year

Thanks for the news on the coal plant. I hadn't heard that, and it sounds like really awesome news.
 
  • Like
Reactions: UltradoomY
Below is commentary this morning from Craig Johnson, the chief market technician at Piper Sandler.

Tesla Inc (TSLA - $781.31); Shares have broken out from a multi-month descending triangle/surpassed resistance near $763; recent bullish crossover between the 10-/30- week WMAs; RS has bounced back into positive territory and impressive TechniGrade ranking; add to positions, a retest of the ‘21 highs near $883 appears likely.
 
Technical analysis, price predictions and news on Tesla stock for week ending 10/02/2021. Tesla will find resistance at $785. If it breaks above that, we will see it run to resistance at $835. A break above that and it will likely run to the next resistance level at $875. Finally, a break above that would set it up for a bull run to all time highs at $1050! Bear case, we have support at $765, then $730. A break lower, and it will find support of the 50 and 200DMA at $721 and $701 respectively.

Tesla news this week includes:
  • Tesla Shanghai to make 300,000 cars through three quarters of the year despite chip shortage
  • Where we are on the S-Curve for Tesla Vehicle Sales
  • Piper Sandler raises estimates on Tesla ahead of ‘best-ever quarter’ in Q3
  • Chamath Palihapitiya sells all Tesla stock holdings to fund other investment ideas

 
todays TSLA graph looks quite odd to me. a down day for the market, TSLA gap up opening and drifting down, yet closes up, yet A/D is down
the Accumulation/Distribution line (a confirmatory indicator) i don't understand, as a downward slope, 2/3 of shares, 19 million of ~30 million sold at fractionally lower prices
what the heck is going on? it's still upwards since 8/9. I defer to wiser minds

1633378182064.png

Its like around 1:30 the A/D started back upwards, SP went flat, A/D went from 90% down to ~65% down
1633378319943.png


since 8/9 to 10/4
1633378615567.png
 
todays TSLA graph looks quite odd to me. a down day for the market, TSLA gap up opening and drifting down, yet closes up, yet A/D is down
the Accumulation/Distribution line (a confirmatory indicator) i don't understand, as a downward slope, 2/3 of shares, 19 million of ~30 million sold at fractionally lower prices
what the heck is going on? it's still upwards since 8/9. I defer to wiser minds

View attachment 717842
Its like around 1:30 the A/D started back upwards, SP went flat, A/D went from 90% down to ~65% down
View attachment 717843

since 8/9 to 10/4
View attachment 717844
The market makers are our friends right now. Just check the price people are willing to pay for puts vs. calls - puts were going for 3-4 times the price than calls. There are also a huge amount of puts against TSLA right now. The manipulation that we always complain about is actually working in our favor right now simply due to the bears outnumbering the bulls by a wide margin. This is just what I see as an active option trader.
 
The market makers are our friends right now. Just check the price people are willing to pay for puts vs. calls - puts were going for 3-4 times the price than calls. There are also a huge amount of puts against TSLA right now. The manipulation that we always complain about is actually working in our favor right now simply due to the bears outnumbering the bulls by a wide margin. This is just what I see as an active option trader.
so from a very naive understanding of options, and a visualization of the stock price channel with Bollinger bands envelop, if i understand what you are saying, there is 3-4 times the downward pressure than upward pressure keeping the channel from increasing its upward slope, or “rapid stair stepping up” to a higher balance level price, while shorts, in aggregate, transfer another few Billions to longs 😎❤️ (a few more Kynikos! yay!)
and
perhaps this downward pressure is enhanced by “virtual shares” that don’t exist except in shorts bookkeeping ledgers

it would seem to my naive understanding that the ledgers only get balanced, even if not completely, by stock dividends/splits/what have you when “hands are forced”

is this also why, at present, the “options wheel” is so lucrative for folks who have noticed this imbalance as an aside question
 
Last edited:
so from a very naive understanding of options, and a visualization of the stock price channel with Bollinger bands envelop, if i understand what you are saying, there is 3-4 times the downward pressure than upward pressure keeping the channel from increasing its upward slope, or “rapid stair stepping up” to a higher balance level price, while shorts, in aggregate, transfer another few Billions to longs 😎❤️ (a few more Kynikos! yay!) and perhaps this downward pressure is enhanced by “virtual shares” that don’t exist except in shorts bookkeeping ledgers

it would seem to my naive understanding that the ledgers only get balanced, even if not completely, by stock dividends/splits/what have you when “hands are forced”

is this also why, at present, the “options wheel” is so lucrative for folks who have noticed this imbalance as an aside question

I think there is actually 3-4 times the upward pressure on the stock right now, and that's why TSLA barely went down despite the overall market taking a dump recently. TSLA has high beta so it usually moves 2-3x as the overall market. If SPY and QQQ are going down 5%, we are more used to seeing a 10-15% decline in TSLA right?

If you are not familiar with the options market, you can look up the concept of "max pain". You can also look up the max pain for each week here. The idea is that most of the options in the market are sold by market makers. They don't really care whether the stock goes up or down, they just want to capture the most premium possible - basically they are the sportsbook. Just like a bookie would adjust the odds if too much money is flowing to one side, the market makers will manipulate the stock price to favor their overall position.

There is a big imbalance between calls and puts right now. For example, if you want to place a bet on TSLA going up 10% and buy the $860 call for next week, it will cost you about $1.10 ($110), but a 10% bearish bet of $705 put will cost $5.85 ($585). The volume on puts are also overwhelming on the bearish side:

1633629842904.png


If the stock price starts declining from the current $775-790 level, it will be in the market makers' interest to keep it above $750 so almost 90+% of the puts can calls will expire worthless.

In layman's term, imagine there's fixed boxing fight about to happen. 90% of the money are betting on fighter A (puts). As the fight organizer would you tell fighter A or fighter B to take a dive? There are so many bears on TSLA right now they are actually helping the stock stay up lol.
 
I think there is actually 3-4 times the upward pressure on the stock right now, and that's why TSLA barely went down despite the overall market taking a dump recently. TSLA has high beta so it usually moves 2-3x as the overall market. If SPY and QQQ are going down 5%, we are more used to seeing a 10-15% decline in TSLA right?

If you are not familiar with the options market, you can look up the concept of "max pain". You can also look up the max pain for each week here. The idea is that most of the options in the market are sold by market makers. They don't really care whether the stock goes up or down, they just want to capture the most premium possible - basically they are the sportsbook. Just like a bookie would adjust the odds if too much money is flowing to one side, the market makers will manipulate the stock price to favor their overall position.

There is a big imbalance between calls and puts right now. For example, if you want to place a bet on TSLA going up 10% and buy the $860 call for next week, it will cost you about $1.10 ($110), but a 10% bearish bet of $705 put will cost $5.85 ($585). The volume on puts are also overwhelming on the bearish side:

View attachment 718854

If the stock price starts declining from the current $775-790 level, it will be in the market makers' interest to keep it above $750 so almost 90+% of the puts can calls will expire worthless.

In layman's term, imagine there's fixed boxing fight about to happen. 90% of the money are betting on fighter A (puts). As the fight organizer would you tell fighter A or fighter B to take a dive? There are so many bears on TSLA right now they are actually helping the stock stay up lol.

I think there's another possibility (or at least component) at work here -- bullish traders selling put options to market makers to take advantage of the high premiums.
 
Just check the price people are willing to pay for puts vs. calls - puts were going for 3-4 times the price than calls.

Not sure how to interpret this. Puts often return better extrinsic premium than calls, but we're talking some small %, not multiples.

There are also a huge amount of puts against TSLA right now.

While the ratio of OI to Average OI suggests we're put heavy, and I guess we're talking semantics at this point, but IMO its not a huge difference.

1633639348874.png


If you are not familiar with the options market, you can look up the concept of "max pain".

Be careful on over-indexing on the concept of max pain. There's compelling logic to it, but it only goes so far. Useful is the visualization of call and put walls for sure, but using max pain value on any given week as a target is quite dangerous, since fairly significantly underlying movement each way from that target will result in only incremental additional exposure. The max pain curve is more of a bathtub, as it were.