Welcome to Tesla Motors Club
Discuss Tesla's Model S, Model 3, Model X, Model Y, Cybertruck, Roadster and More.
Register

Bought a 40.5k miles 2020 Model 3 with significant Battery degradation. What can I do?

This site may earn commission on affiliate links.
Hello all!,

I am a first-time Tesla owner. I would like to know your opinion on my findings.

As I mentioned, I just purchased a certified preowned Model 3 with 40.500 miles through the tesla.com website. I did a good research about Teslas and, among other EVs I considered it the best option.

My experience is mixed. The car looks really good and is in very good shape, also thought I found a very good deal with tesla warranty and the car specs being a Standard Range plus, with 19" wheels and enhanced AP.

My first problem came when we started driving the car. My wife started hearing a weird noise when moving slowly or starting to move. I found out that the lug nuts in the 4 wheels were loose, especially the rear passenger-side one where the noise was coming from. I tightened the lug nuts myself and called Tesla service immediately to check the car in case anything had suffered.

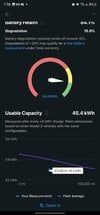
My second problem is that I noticed a really low range in my car after a week of driving and wanted to obtain some guidance. I have downloaded the Tessie app to check and also performed a battery health test in service mode to test against the Tessie app. Here are my findings and some other stats:

-Battery degradation according to Tessie: 15.9%
-Battery health according to health Test on the car: 85% (or 15% degradation)
-Car calculated Range 217mi. (217/250*100 = 86.8% so math kinda checks out)
-Average efficiency according to Tessie app: 75% or 287Wh/mi. This is counting other factors based on my real world use. Which means I get around 162.75mi of real range(0.75*217mi). To my surprise, less range can be driven
-Battery total full load when charged 45.4Kwh. Rated is 54Kwh ( 45.4/54*100 = ~84% Again math maths)

I live in Florida and the weather is really hot during the summer I understand have a big impact in efficiency

I understand I have battery coverage under 100.000 miles if my battery range drops under 70%. But in any case, this seems out of the normal of what I have seen around and by the app and other stats. What can I do to improve my situation based on the information provided? See attached pictures of my health test and Tessie app stats
 

Attachments

  • Screenshot_20230611_195653.jpg
    Screenshot_20230611_195653.jpg
    123 KB · Views: 483
  • 20230611_113345.jpg
    20230611_113345.jpg
    383 KB · Views: 461
Solution
It really sucks the fact battery is under warranty but due to the asymptotic nature of the degradation I won't likely get to the 70% degradation before the 100k miles unless i treat it worse than the previous owner going forward(ironic). Definitely an oversight on my research.
Welcome!

This may be difficult but my suggestion is to not worry about it and enjoy the car!

There is always some degradation. There is calendar day degradation that has nothing to do with how the car was treated. You may have more than normal but, as you note, you're only halfway to warranty limit. Many people opt for and road trip with a Model Y which starts out with 8% range loss compared to the 3.

I know someone whose battery died after...
However, every other day or every third day can be a lot better. Every time we have a partial charging session (even a shallow one), we're stressing the battery, thus encouraging further degradation.
That is not correct.

The smaller the cycles, the better.

Two 10% DoD cycles is better than one 20%.
Two 20% DoD cycles is better than one 40%.
The degradation of two small cycles is less than a single cycle.

Also, cyclic aging is only a fraction of calendar aging for the first five years or so so it is calendar aging we should active try to reduce. (Both is better of from low SOC and small cycles).
 
Upvote 0
Two 10% DoD cycles is better than one 20%.
Two 20% DoD cycles is better than one 40%.
The degradation of two small cycles is less than a single cycle.

They can't be better.
Beside the inconveniences, are you telling me that excessive charging sessions, putting battery under undue stress, have nothing to do with degradation?

How much degradation can we save over a period of one year and five years by following your rules?
 
Upvote 0
There is an opportunity for Tesla to provide transparency, and a feeling of trust in the used car process by informing buyers about the current state of battery health. It’s so easy to query the car by going into service mode, they might as well reveal it to potential buyers early in the process.
If they did that no one will buy the cars. The price of the car is already reflecting that. Tesla probably priced the car lower because of the battery.
 
  • Disagree
Reactions: gaswalla
Upvote 0
They can't be better.
Beside the inconveniences, are you telling me that excessive charging sessions, putting battery under undue stress, have nothing to do with degradation?

How much degradation can we save over a period of one year and five years by following your rules?

Its pretty common knowledge that shallow cycles are much better for battery health. Charging, especially at lower SoC, doesn't stress the battery at all. Just google "shallow cycles better for battery" and you get a million articles saying the same thing.
 
  • Like
Reactions: GSP
Upvote 0
They can't be better.
Beside the inconveniences, are you telling me that excessive charging sessions, putting battery under undue stress, have nothing to do with degradation?

How much degradation can we save over a period of one year and five years by following your rules?
You need to do some homework.

I suppose you use the result from science and research.

Calendar aging is cut in half by simply having the SOC at 55% or below compared to above 55%.
This will set the degradation from calendar aging during a four year period from 10% to 5% in a average climat with a average cell temp of 25C.
7C131AB6-0915-4C38-BBB6-FF035E57E726.jpeg


During the same time, for the average deiven car, the car will perhaps do 60-80K km. This is about 70000/400 =175 full cycles (FCE).

Picture shows Tesla 2170 model 3 cells cycled 0-100, 0-50 and 50-100%.
In average they lis about 15% for 1000 cycles, still they where cylced much harder
than the do in a EV.

15 x 175/1000= 2.6% loss for the cycles. IRL the average cycles is smaller in an EV and also much less C-rate so we can expect less cyclig aging.
8F52419F-3565-44DF-9790-9316CAA9B45F.jpeg


I suppose to begin with reading this research report:
https://mediatum.ub.tum.de/doc/1355829/document.pdf

There are a lot of research and almost any report points in the same direction.
There is a very few not good reports ( wrong setup in the research test, or wrong conclusions or a combo).

There is really no uncertainty how it all work.

When the report above is thoroughly read, there is many more.
Just search for calendar aging, cyclic
aging and lithium ion or NCA ( as Tesla/ Panasonic use NCA chemistry).
Read research reports, not EV homesites as
They in many cases is lured by the myths.
 
Upvote 0
You need to do some homework.

I suppose you use the result from science and research
I needed the required prerequisites to get my facts straight. Thanks for your patience. I appreciate your detailed explanation. I'm still not sure whether calendar aging or cycle aging is a major factor in battery degradation at say 5 years/60,000 mi mark. What could be their expected average proportions?
 
  • Like
Reactions: GSP and AAKEE
Upvote 0
I needed the required prerequisites to get my facts straight. Thanks for your patience. I appreciate your detailed explanation. I'm still not sure whether calendar aging or cycle aging is a major factor in battery degradation at say 5 years/60,000 mi mark. What could be their expected average proportions?
In a average climate (cell temp average around 25C) the calendar aging ”costs about 5-5.5% the first year if the SOC is above 60% most of the time.
Calendar aging is reducing with the square root of time so this is the approximate degradation by time:
5% after one year
7% after two years
8.7% after three years
10% after four years
11.2% after five years
12.2% after six years
13.2% after seven years
14.1% after eight years.

Numbers above are of course not exactly to the points, but points used as rounding to whole numbers would make degradation during some years look strange.


Typical degradation per FCE look like this:
074C0B00-DAA2-4661-BAD7-A4CC36AD81DD.jpeg

This is Panasonic 18650 NCA cells, as close as we get to real tesla cells (I have examples with true tesla cells, but not with small cycles).

We can se that cycles in low range cause low degradation. About 10% for 1250FCE.
1250 FCE = 1250 x 400 km = 500K km

Thats is about 1% per 50K km or 310K miles, and some 0.5% per 25K km or about the annual driving.
(Full cycles 100-0% doubles this so about 1% annual…but most people do not do full 100-0% cycles every time.

As we se, calendar aging causes much more degradation for at least the 5-8 years, and probably more than this.
 
  • Informative
Reactions: BitJam and GSP
Upvote 0
@AAKEE
What do you feel would be the trade off in a situation where miles driven daily is low. Let's say using <10% of the battery/day, and a scenario where charging is set to a 50% SOC. Would it be better to let the average battery percentage drift down for a few days, where one could achieve 24hrs at a 40% SOC, 24hrs @ 30% SOC and then charge back to 50%. Alternatively a scenario where you charge every day with a shorter cycle, but are constantly maintaining a battery between 40% SOC and 50% SOC. Just curious....Since Calendar aging is the largest percentage of degradation in the first few years.
 
  • Like
Reactions: AAKEE
Upvote 0
@AAKEE
What do you feel would be the trade off in a situation where miles driven daily is low. Let's say using <10% of the battery/day, and a scenario where charging is set to a 50% SOC. Would it be better to let the average battery percentage drift down for a few days, where one could achieve 24hrs at a 40% SOC, 24hrs @ 30% SOC and then charge back to 50%
Its a matter of taste.

Calendar aging is more of the same between 30-55%, its kind of a plateu.

I did select 55% as it was a good compromise between range and still low calendar aging.
When I was commuting daily I returned with about 25-35% anyway.

55% also takes me to nearest SuC in any direction so I can actually go where I wabt with 55% from home.

There might be a small win in calendar aging by letting it drift down if driven very little. Not sure you would see the difference between two cars each choosing one of the charging principles.

. Alternatively a scenario where you charge every day with a shorter cycle, but are constantly maintaining a battery between 40% SOC and 50% SOC. Just curious....Since Calendar aging is the largest percentage of degradation in the first few years.
I decided to try to reduce calendar aging without making the EV owning a pain in the…
Staying below 55% when the car is not driven is the thing that really makes the difference.

Working really really hard to save 0.3% in five years might not be worth it…
 
Upvote 0
In a average climate (cell temp average around 25C) the calendar aging ”costs about 5-5.5% the first year if the SOC is above 60% most of the time.
Calendar aging is reducing with the square root of time so this is the approximate degradation by time:
5% after one year
7% after two years
8.7% after three years
10% after four years
11.2% after five years
12.2% after six years
13.2% after seven years
14.1% after eight years.

Numbers above are of course not exactly to the points, but points used as rounding to whole numbers would make degradation during some years look strange.


Typical degradation per FCE look like this:
View attachment 951217
This is Panasonic 18650 NCA cells, as close as we get to real tesla cells (I have examples with true tesla cells, but not with small cycles).

We can se that cycles in low range cause low degradation. About 10% for 1250FCE.
1250 FCE = 1250 x 400 km = 500K km

Thats is about 1% per 50K km or 310K miles, and some 0.5% per 25K km or about the annual driving.
(Full cycles 100-0% doubles this so about 1% annual…but most people do not do full 100-0% cycles every time.

As we se, calendar aging causes much more degradation for at least the 5-8 years, and probably more than this.
5% "calendar" or time degradation, for one year, sounds way too high to be an average. Of course there a ton of variables, but if you have 5% degradation in your first year, there is some component of your driving/charging routine that could likely yield better results.
I have less than 1% total degradation in 20,000 miles (358 miles brand new to 355 now at 100%) and my SOC begins around 80-85% daily for my commute, so keeping under 60% most of the time to yield the least amount of degradation has not been my experience at all.
 
Upvote 0
5% "calendar" or time degradation, for one year, sounds way too high to be an average.
These 5% is very common.
Colder environment reduces it, as does low SOC.

Your 3 Long range has a 82kWh battery?

The degradation threshold is 79 kWh do you do not loose any range ubtil it drops below 79kWh.

355miles equals about 78.3 kWh capacity,

We can discuss from what value we should start counting degradation.
Marked 82.1kWh and usually sits at 80.5 or so at delivery (according to the BMS) so its 3% loss from the most usual initial number.
Or 4.5% from the ”Full Pack When New” number.
Depending on how we see it, you might not be that far from those 5%.

I sold my M3P 2021 with the same battery, one week ago after exactly 2 1/2 years and 66000km (41K mi)
and I had about 78.4-78.5 kWh capacity left.
That is quite good after that time (miles wear less).
 
  • Like
Reactions: AlanSubie4Life
Upvote 0
Yeah I have the big 82kWh. I had no idea that my range doesn't drop until I get below 79kWh. But that does make sense there's a buffer on the top, given that there is also a buffer on the bottom end so that you can still drive a short distance at 0% SOC.
I would say from your statistics that if I'm at 80.5 kWh brand new showing 358 miles, then it's a fair assessment from my calculations that I'm currently at or near 79.8kWh at 355. I plan on keeping it for 10+ years, unless there's some huge differences in the new Model 3's, which I really don't think will be the case since there are constant updates to the current fleet. Only changes I really foresee are of course, longer range and cosmetic, and perhaps better longevity.
No, the range do not drop until the capacity os below 79kWh: your car is at 355 (?) so you did loose 3 miles at 220Wh/ mile.
Current capacity is 78.3 (give or take).

You can perform the energy graph calculation to find the capacity at 78.3kWh

Its not really a top buffer but just a threshold, where the range do not increase if the capacity is above 79kWh. Range is at
Max, so no increased range from having 81 or 82kWh. Each percent will be adjusted to contain a little nore energy to keep the range at max value.

On the other way around, the range do not decrease until the capacity goes below 79kWh. There is about 3kWh hidden degradation if we count from the full pack when new value.

The bottom buffer ( below 0% on the screen) is 4.5% of the total capacity
 
Upvote 0
Its pretty common knowledge that shallow cycles are much better for battery health. Charging, especially at lower SoC, doesn't stress the battery at all. Just google "shallow cycles better for battery" and you get a million articles saying the same thing.

I think this is a slight over-generalization. What bothers the battery is sitting at higher states of charge with the 60% region being particularly important if you look at the available charts on loss-over-time vs SOC.

I doubt there's much difference in charging 2x from 20% to 30% vs one time from 20% to 40%.

However charging 2x from 20% to 50% IS likely gentler on the pack than one time from 20% to 80%.

But that's because the second case put the pack above 60%, not because it was one cycle vs two.

Nightly charging from "wherever" to 50% is a great strategy for pack life, using the full pack range only when traveling long distances
 
Upvote 0
I think this is a slight over-generalization. What bothers the battery is sitting at higher states of charge with the 60% region being particularly important if you look at the available charts on loss-over-time vs SOC.

I doubt there's much difference in charging 2x from 20% to 30% vs one time from 20% to 40%.

However charging 2x from 20% to 50% IS likely gentler on the pack than one time from 20% to 80%.

But that's because the second case put the pack above 60%, not because it was one cycle vs two.
We need to make a difference between calendar and cyclic aging.

In general cyclic aging is less for small cycles at low SOC.
But the cyclic aging is very low compared to calendar aging the first five years or so.

For cycles I havent seen any specific correlation to 60%.

This is Panasonic 18650 NCA discharged from the voltage in the scale to 0% (2.5V), with 1A ( = about 0.3C, so not far from highway driving)
3.7V about 50%
3.8V about 60%
3.9V about 70%
4.0V about 80%
4.1V about 90%
4.2V about 100%
DBCF2BBE-DFED-4FF8-A9B3-9BC9DB15B118.jpeg


Nightly charging from "wherever" to 50% is a great strategy for pack life, using the full pack range only when traveling long distances
Yup.
 
Upvote 0
I have less than 1% total degradation in 20,000 miles (358 miles brand new to 355 now at 100%)
As @AAKEE says, closer to 3%, depending what you started with exactly.
I had no idea that my range doesn't drop until I get below 79kWh
That’s right. Before you get below 79kWh, the available energy is divided equally between each of the 358 rated miles (and then scaled by 0.955 for the displayed miles). So they (the miles) have essentially expanded energy content. This has been verified. After you drop below the degradation threshold of 79kWh or 79.1kWh for your vehicle, then you start to show miles loss and the energy is constant for each mile (79kWh/358mi is the content…plus adjust by 0.955 if you are looking at displayed rated miles to account for the buffer to get actual usable energy content).
if I'm at 80.5 kWh brand new showing 358 miles, then it's a fair assessment from my calculations that I'm currently at or near 79.8kWh at 355
So yes it does not work this way as you can see from above. You are below the threshold of 79kWh since you are showing loss of range. Above 79kWh it is really hard without SMT to figure out exact energy in pack - requires very careful metering on a long trip to figure it out.
 
Upvote 0
We need to make a difference between calendar and cyclic aging.

In general cyclic aging is less for small cycles at low SOC.
But the cyclic aging is very low compared to calendar aging the first five years or so.

For cycles I havent seen any specific correlation to 60%.

This is Panasonic 18650 NCA discharged from the voltage in the scale to 0% (2.5V), with 1A ( = about 0.3C, so not far from highway driving)
3.7V about 50%
3.8V about 60%
3.9V about 70%
4.0V about 80%
4.1V about 90%
4.2V about 100%
View attachment 954733


Yup.

I think we agree. Note that the above chart would need to be adjusted for the number of cycles since it takes twice as many shallow-cycles to go the same distance as a twice as deep cycle. This is where I think you quickly find a wash. For example I think the 4.5 line at 500 cycles is just about equal to the 3.9 line at 1000 cycles (and you'd get almost the same driving range from both).

I think the best advice to new owners is to lean in the direction of operating near 50% SOC when convenient, use full SOC when needed, and simply accept that beyond that shaving a percent or two, calendar aging is gonna happen on every single car no matter how you treat it so just drive the thing and know that years down the road it'll be off 10% or 20%.
 
Upvote 0
In a average climate (cell temp average around 25C) the calendar aging ”costs about 5-5.5% the first year if the SOC is above 60% most of the time.
Calendar aging is reducing with the square root of time so this is the approximate degradation by time:
5% after one year
7% after two years
8.7% after three years
10% after four years
11.2% after five years
12.2% after six years
13.2% after seven years
14.1% after eight years.

Numbers above are of course not exactly to the points, but points used as rounding to whole numbers would make degradation during some years look strange.


Typical degradation per FCE look like this:
View attachment 951217
This is Panasonic 18650 NCA cells, as close as we get to real tesla cells (I have examples with true tesla cells, but not with small cycles).

We can se that cycles in low range cause low degradation. About 10% for 1250FCE.
1250 FCE = 1250 x 400 km = 500K km

Thats is about 1% per 50K km or 310K miles, and some 0.5% per 25K km or about the annual driving.
(Full cycles 100-0% doubles this so about 1% annual…but most people do not do full 100-0% cycles every time.

As we se, calendar aging causes much more degradation for at least the 5-8 years, and probably more than this.
@AAKEE : what kind of degradation should I expect after one year with the SOC being around 50% most of the time?
And what really is the average degradation being reported for the M3/MY?
I calculated my MY's battery capacity to be right around 79kWh with 1k miles on the Odo using the method ahown here:
Calculating Your Battery's Estimated Capacity Using the Car's Energy Screen
Is this a reliable and fairly accurate method?
 
Upvote 0
I calculated my MY's battery capacity to be right around 79kWh with 1k miles on the Odo using the method ahown here:
Calculating Your Battery's Estimated Capacity Using the Car's Energy Screen
Is this a reliable and fairly accurate method?
One of these days we need to add an addendum to this method in the sticky… This method will be limited to the lesser of the pack capacity and the degradation threshold. In the case of your car this is ~79kWh, the degradation threshold.

Your actual capacity may be higher right now (very likely is 1-2kWh higher but can only be determined with SMT or very careful observation).
 
Upvote 0