Welcome to Tesla Motors Club
Discuss Tesla's Model S, Model 3, Model X, Model Y, Cybertruck, Roadster and More.
Register

Disappointing Range in P3D. Is this normal?

This site may earn commission on affiliate links.
Yikes. That’ll take the extrapolated full range down to 301miles @ 58mph avg;)

Would be super close to making 290miles at >60mph avg I think. But would almost certainly make it, assuming no not-in-your-favor nonlinearity at the bottom of the battery. 65mph I think you almost certainly would not make 290miles.

I’ll do a lap when I get a chance and will post here.

Still beats my last performance car with this level of performance by a LONG way, which would drain a 100 UK Pounds tank of 99 octane fuel in 250miles (if you were gentle) or 55miles if you weren't.
 
  • Like
Reactions: goRt
Still beats my last performance car with this level of performance by a LONG way, which would drain a 100 UK Pounds tank of 99 octane fuel in 250miles (if you were gentle) or 55miles if you weren't.

Yeah it's not bad. And swap out those tires and you'll actually make the rated range at 60mph+, it looks like to me.

Another thing I noticed...did not notice before. Generally this was not a round trip, and the other issue with that (and any trip that is not an out and back actually - even the originally proposed loop would not have been perfect), other than the elevation, is the wind.

As you said, it was very windy yesterday. And the winds were generally from the southwest.

This benefited you most likely, net, because you were generally traveling northeast (net) from your starting point (started near Golden Triangle and ended in North County). (Not sure if you made a note of approximately how you were doing when you completed your first (approximate) loop.)

This is representative Solana Beach data; it shows about a 10mph tail wind (well..SW or WSW) or so at around noon yesterday (May 22nd), and it could have been higher or lower.

MesoWest Observation

With the originally proposed route, it would be better, but possibly not perfect, as the winds at the coast on I-5 could potentially be stronger (or weaker) than the inland winds on I-15.

So I'd say the jury is still out - but I still think it is fairly likely you could get to 290miles at about 60mph round trip, it's just going to be close.
 
Last edited:
Yeah it's not bad. And swap out those tires and you'll actually make the rated range at 60mph+, it looks like to me.

Ahh, no thanks. I'd rather keep the performance thanks.

So I'd say the jury is still out - but I still think it is fairly likely you could get to 290miles at about 60mph round trip, it's just going to be close.

Yep, until there is an instrumented journey, with that distance, it's all estimation.

But in real-life there is always going to be something not optimal (positive or negative). Could do half the loops clockwise/half anti-clockwise, but there can still be a difference over time with respect to weather. Even an out and back, wind-shift can occur. Temperature varies over the period. Traffic changes etc. Or you do it in a lab, and then that's not real-world realistic.

But I think it's in the right ball-park of being possible (Even in a P3D+), AND alot less than the 350-360 Wh/m from the original post. No doubt, going to be slower in a P3D+ than in a LR to do that mileage.

Even so, I must admit, that I don't generally drive like I'd need to to get that mileage. Would rather fill up more often/longer.

As a further note, I don't think any of this is specific to an Electric car. Most of it is just down to physics which apply equally, or more to gas cars. People generally don't obsess about the size/range of a gas car's tank, whether it can get 310 or 290 miles and feel cheated if in reality they individually come up 5% short.
 
FWIW, I have noticed a large improvement in range after MCS Coilovers (roughly 1.5" drop), Unplugged Performance Front Lip, and my own custom rear diffuser. This is even with two large holes in my front aero shield (brake ducts), which I still haven't made an insert for lol.

Miles Driven: 50
Average Speed: 74.88mph
Wh/Mi: 255
Ambient Temp: 95f
HVAC: A/C On, 75f

Previously, (same wheels and tires) I was averaging roughly 300wh/mi with the HVAC OFF @ 75MPH.

Note: Aftermarket 18" Wheels w/ Factory 18" Michelin Tires
 
Last edited:
  • Funny
  • Informative
Reactions: tschmidty and 03DSG
FWIW, I have noticed a large improvement in range after MCS Coilovers (roughly 1.5" drop), Unplugged Performance Front Lip, and my own custom rear diffuser. This is even with two large holes in my front aero shield (brake ducts), which I still haven't made an insert for lol.

Miles Driven: 50
Average Speed: 74.88mph
Wh/Mi: 255
Ambient Temp: 95f
HVAC: A/C On, 75f

Previously, (same wheels and tires) I was averaging roughly 300wh/mi with the HVAC OFF @ 75MPH.

Note: Aftermarket 18" Wheels w/ Factory 18" Michelin Tires

A little surprised it helped that much, though lowering helps. Any idea what made the biggest difference?

I would expect the baseline P3D- to maybe do 260Wh/mi at that speed (with aero wheels). Hard to say exactly. The 300Wh/mi definitely seems a little high as a baseline at 75mph with those tires - I would expect to do slightly better than that in the P3D+ with 20” PS4S at 75mph - I’d expect to get about 295Wh/mi! So with the MXM4s should be about 265Wh/mi-270Wh/mi.

Hard to say, I am certain lowering it 1.5" made a difference. I am not sure the UP Front Lip Spoiler made a difference. I would have to do a before and after to say for sure, but their data suggests it should be making a difference.

My baseline was as follows:

Drove: 156 Miles
Consumed: 52.4kWh
9:24AM-11:33AM
Avg Speed: 72.56
Wh/Mi: 335
Ambient: 52f
HVAC: OFF

Considering ambient temps were low, I am assuming the same drive in similar ambient temps to yesterday would bring consumption down to about 300 Wh/Mi.

Does anyone else on here have a Stock P3D+ running stock MXM4's who can do a drive at 75MPH for comparison? It wouldn't be a 1-1 comparison as my aftermarket wheels are definitely not as efficient as the aero wheels, and everyone's aftermarket 18's will vary, but it should be close.
 
Miles Driven: 50
Average Speed: 74.88mph
Wh/Mi: 255
Ambient Temp: 95f
HVAC: A/C On, 75f
It’s great to see this kind of testing, especially with stock vs modified cars. However, this data is basically meaningless without accounting for winds. Light winds, from any direction, can have a significant effect on the results. Driving round trips or loops helps but doesn’t completely cancel out the effects of the wind. Even “calm” winds can be 3-5mph and could shift the results. I’d love to see more real-world test results but please let us know what the winds were doing.
 
  • Like
Reactions: AlanSubie4Life
It’s great to see this kind of testing, especially with stock vs modified cars. However, this data is basically meaningless without accounting for winds. Light winds, from any direction, can have a significant effect on the results. Driving round trips or loops helps but doesn’t completely cancel out the effects of the wind. Even “calm” winds can be 3-5mph and could shift the results. I’d love to see more real-world test results but please let us know what the winds were doing.

Very good point! I was traveling East and there were 3-5mph winds from the South. No gust.
 
  • Like
Reactions: Zoomit
Just to add a few simulated numbers to this conversation, let's consider a 4 mph wind. If we stood outside in this wind, we don't perceive it as significant. Most people would probably call it "calm". I'd probably call it "light and variable". It's hard to tell what direction it's coming from sometimes. A wet finger held up tells us nothing and blades of grass dropped from shoulder height basically fall at our feet.

Now let's look at 3P-20" energy consumption at highway speeds. With no wind, just increasing the speed from 75 to 79 mph increases consumption by 6.6%. Decreasing speed from 75 to 71 mph decreases consumption by 6.2%.

Now let's have this car stay at 75 mph but add a 4 mph straight-on headwind. Energy consumption increases by 10.7%. With a 4 mph tailwind, consumption decreases by 9.6%. I was surprised at this. That's a large effect! I rechecked my old spreadsheet, as one does, and it all seems to check out. Fundamentally, what happens is that the car spends more time with the higher aero drag than it would if just traveling at the higher speeds. Energy consumption is energy used over distance (Wh/mi). In this example, the car spends 5.3% longer traveling at 75 mph vs 79 mph to go the same distance.

So with a barely perceivable wind, Wh/mi measurements at highway speeds can vary by +/-10% due to that wind alone.

What about a 4 mph direct crosswind at 75 mph? That's 75.11 mph at a 3 deg crab angle. The 0.11 mph faster airspeed increases the energy consumption by 0.3%. I don't know how quickly the Model 3 CdA rises with crab angle, while it certainly does, the difference is likely small at 3 deg. So a 4 mph crosswind may increase the Wh/mi measurement by 0.5-1.0%.

For those curious, a 10 mph headwind while driving at 75mph increases energy consumption by about 29% and a 10 mph tailwind decreases it by 22%. If you do a round-trip test by driving into a 10 mph headwind, then return with the tailwind, just averaging those results introduces a 3.5% error [(1.29+0.78)/2].
 
Now let's look at 3P-20" energy consumption at highway speeds. With no wind, just increasing the speed from 75 to 79 mph increases consumption by 6.6%. Decreasing speed from 75 to 71 mph decreases consumption by 6.2%.

Now let's have this car stay at 75 mph but add a 4 mph straight-on headwind. Energy consumption increases by 10.7%. With a 4 mph tailwind, consumption decreases by 9.6%. I was surprised at this. That's a large effect! I rechecked my old spreadsheet, as one does, and it all seems to check out. Fundamentally, what happens is that the car spends more time with the higher aero drag than it would if just traveling at the higher speeds. Energy consumption is energy used over distance (Wh/mi). In this example, the car spends 5.3% longer traveling at 75 mph vs 79 mph to go the same distance.

For those curious, a 10 mph headwind while driving at 75mph increases energy consumption by about 29% and a 10 mph tailwind decreases it by 22%. If you do a round-trip test by driving into a 10 mph headwind, then return with the tailwind, just averaging those results introduces a 3.5% error [(1.29+0.78)/2].

There are so many variables it is very difficult to figure out expected efficiency - especially at freeway speeds. And temperature seems to make a surprisingly large difference even if the HVAC is off...

1) Yes, power to overcome drag goes up as the cube of velocity. But sadly in the case of wind we don't get to "lose" one of those powers (and just get the standard "Wh/mi increases proportional to square of velocity" by reducing the time over which the power is exerted). (As your numbers show, energy to complete a standard trip does not simply scale by the square of the velocity, of course, since aero loss is not the only thing...since there are some losses that are fixed per unit distance, and others that are fixed per unit time (and go down the faster you go).)

2) Yes, round trip with wind doesn't "cancel out", due to the nonlinear nature of the losses. For the same reason, average speed on a trip is often misleading - especially if most of what pulls down the average is very slow travel (typical for freeway runs with brief surface streets before/after). In these cases, it's hard to calculate the effective speed to use, but generally you should quote your typical freeway speed.

3) If you want to see historical wind data for a particular trip, you can visit: NWS Weather & Hazards (This is centered on San Diego (SGX), but you can pan around or use your local weather service station code.) Click on a weather station and you can easily see 3 & 7-day historical data.

Anyway, here is data from a 26-mile round trip generally north/south - though about 25% was into/out of the wind, from above website, winds were about 2-4mph from the west - was hard to notice the impact since the outboundwhich was partially east was also slightly downhill)

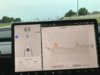
Round trip (as close as exits allowed), P3D+, stock:
Average speed 71mph
Freeway speeds (vast majority of time): 75-80mph
Distance: 26.3
miles
Time: 22 minutes
Net elevation change: -13 feet (from Gaia GPS: +742 ft, -755 ft) (No hills came close to regen so minimal impact)
Wh/mi: 275Wh/mi
HVAC basically off (some brief fan ONLY use)
Temp: 65-70 degrees, sunny
So I think this aligns pretty well with a true average speed of 75mph (with peak speeds more consistently at 75-80mph) ending up around 295Wh/mi (it might end up being a bit lower). It was a short segment but I did start the segment after the car had "warmed up" - so if there is any significant starting overhead that would have been excluded.
 
Last edited:
And temperature seems to make a surprisingly large difference even if the HVAC is off...
I'd be curious to hear what you consider a large difference. Assuming HVAC is off, temperature primarily affects atmospheric pressure along with tire compound temperature and tire pressure. Looking only at atmospheric pressure (ignoring HVAC, tires and assuming a warm battery and no BMS losses), my Model 3 energy consumption model drops by 1% per 9F (5C) rise in temperature. For example, consumption and range would be 3% better in 90F temps verses 63F.

In your case, you might see 273 to 281Wh/mi over that same 63 to 90F range. (Again this assumes a warm battery, no precipitation or wet roads, no tire temp effects, no HVAC)
3) If you want to see historical wind data for a particular trip, you can visit: NWS Weather & Hazards (This is centered on San Diego (SGX), but you can pan around or use your local weather service station code.) Click on a weather station and you can easily see 3 & 7-day historical data.
That is a good site, though I've always wished they provided more than 7 days of historical data.
a true average speed of 75mph (with peak speeds more consistently at 75-80mph) ending up around 295Wh/mi (it might end up being a bit lower).
Seems reasonable. That'd put the EPA range match speed in the low 60's mph for the 3P, assuming 72 kWh used.
 
Does anyone else on here have a Stock P3D+ running stock MXM4's who can do a drive at 75MPH for comparison?

Hopefully someone will chime in. Only data point I have is my brother with a P3D Stealth (not stock P3D+ except with MXM4s) with a 247Wh/mi flat, calm, 195-mi, average speed about 65mph, but most freeway in excess of 70mph (a big portion at 77mph).
 
Hopefully someone will chime in. Only data point I have is my brother with a P3D Stealth (not stock P3D+ except with MXM4s) with a 247Wh/mi flat, calm, 195-mi, average speed about 65mph, but most freeway in excess of 70mph (a big portion at 77mph).

Was that with Aero covers on or off? Same for HVAC?

On my aforementioned trip I started the calculation mid-drive. The lowest speed was 62mph, the highest was 86mph, and the average was 74.88mph. I had TACC set to 78mph for most of the drive.

I'm pretty happy with 255Wh/mi considering. I suppose the only real way to test if the modifications are helping would be to get a P3D+ and a P3D- to all go on the same trip at the same time. Nonetheless, from all the data I can gather I think there is a legitimate 10-12% difference.

I still have two big holes in my front aero shield and a very un-aerodynamic RPM "Blade" Spoiler installed. With the UP Spoiler, I think there's a decent chance of obtaining the roughly 13% @ 75mph they claim. That is slated to arrive end of July.
 
Hard to say, I am certain lowering it 1.5" made a difference. I am not sure the UP Front Lip Spoiler made a difference. I would have to do a before and after to say for sure, but their data suggests it should be making a difference.

My baseline was as follows:

Drove: 156 Miles
Consumed: 52.4kWh
9:24AM-11:33AM
Avg Speed: 72.56
Wh/Mi: 335
Ambient: 52f
HVAC: OFF

Considering ambient temps were low, I am assuming the same drive in similar ambient temps to yesterday would bring consumption down to about 300 Wh/Mi.

Does anyone else on here have a Stock P3D+ running stock MXM4's who can do a drive at 75MPH for comparison? It wouldn't be a 1-1 comparison as my aftermarket wheels are definitely not as efficient as the aero wheels, and everyone's aftermarket 18's will vary, but it should be close.

We took a trip to Florida from South Carolina which was 450 miles one way and I was able to get consistent 238-240ish kw/mi. This was in my 100% P3D- with the aero covers with my wife and two kids and both the frunk and trunk completely full. I noticed that as long as I stayed between 70-73 I would burn 1 mile or range per 1 mile traveled. Anything faster above 73mph would destroy my range. We did the entire trip on NoA on chill mode and the car did amazing.


IMG_20190420_131222218_HDR.jpg
 
  • Like
Reactions: ppower
I'd be curious to hear what you consider a large difference.

I’m not sure...I have no actual comparative data, but I guess I would say I perceive perhaps a 10Wh/mi difference without HVAC (with identical tire pressures). For a change from 50 degrees to 75 degrees. No idea really, though. Just seems slightly easier to be efficient when it is warmer.

Just went back and read your specifics, and it seems in the ballpark.
 
  • Like
Reactions: Zoomit
I posted the results of a test in a couple of groups but thought it could be beneficial to add here. Logic and articles say that there should have been no discernible improvement, so take this with a grain of salt for now. After seeing even more talk about panel gaps and my frunk gap being larger than I'd prefer, I wondered about the old wive's tale? about taping the seams of a car for high speed. Could I see any benefit at highway speed?

I took a 10 mile section, taken both ways to average out any wind and elevation. Driving in chill, AP at 65, reset the trip once cruising at 65 to avoid acceleration or regen. This is able to be done within an hour keeping weather conditions as close to the same as possible. The longer the distance, the longer the time and changes in conditions through the day could affect it more. This was the most efficient my car has EVER been with or without tape. This makes me wonder if there was something else in the new update.

Open gaps: 214 +308Wh/mi =261Wh/mi average

Taped gaps: 208 +292Wh/mi =250Wh/mi average

4.6% improvement. I imagine the higher the speed, the higher this percentage improvement might be. I don’t know that I want to put on painters tape for every road trip, but I’ll consider it.

Edit 1: 2nd test with botched results.

Open gap:
212 + 297 = 254.5Wh/mi average

Taped gap:
207 + 296 = 251.5Wh/mi average.

So the first trip showed similar efficiency (207 vs 212 and yesterday’s 208 vs 214). I kept driving at steady speed where the highway turned and went from headwind to crosswind and in 3.5 miles dropped the average by 12 Wh/mi. This doesn’t factor into tape vs no tape, but it’s amazing how wind affects the car. Anyway, got home and saw the tape all pulled up. I think it happened at the beginning of the headwind test run and completely negates the information. I'll have to do at least a 3rd try at this. Maybe I can get free and do another test today.

Side note: the big spike is me giving somebody a ride at the end of our Caffeine and Gasoline car meet. Kinda funny to have the big spike in the middle of testing efficiency.
 

Attachments

  • 60960904_10218989096103038_919084604336373760_o.jpg
    60960904_10218989096103038_919084604336373760_o.jpg
    365.9 KB · Views: 38
  • 61346975_10218982381095167_4352735520959234048_o.jpg
    61346975_10218982381095167_4352735520959234048_o.jpg
    288.3 KB · Views: 48
  • 60832812_10218982324973764_4720471449771442176_o.jpg
    60832812_10218982324973764_4720471449771442176_o.jpg
    195 KB · Views: 32
  • 61036710_10218982324133743_6652236018822938624_o.jpg
    61036710_10218982324133743_6652236018822938624_o.jpg
    221.9 KB · Views: 43
  • 61130054_10218982323253721_5262669560032526336_o.jpg
    61130054_10218982323253721_5262669560032526336_o.jpg
    190.7 KB · Views: 36
  • 60884039_10218982322973714_418819462376980480_o.jpg
    60884039_10218982322973714_418819462376980480_o.jpg
    189 KB · Views: 42
  • 61700123_10216125810150494_5214092470597451776_n.jpg
    61700123_10216125810150494_5214092470597451776_n.jpg
    92.3 KB · Views: 37
  • Like
Reactions: Zoomit
....able to be done within an hour keeping weather conditions as close to the same as possible.....

I'll have to do at least a 3rd try at this. Maybe I can get free and do another test today

If you try again...I would do a 10-20 mile warmup before starting (you could record those results of course), and I would wait for completely calm winds if possible. In Tulsa that could be a tough ask.

It is just possible that if the battery has not reached a steady state temperature that it could be less efficient. Another option (but would not be able to do a true comparison) is to start with tape and then do the second run without tape.
 
You know, there are so many variables that can be realistically controlled. Mixing it up by doing tape first would be good, and so would having time to make a second pass of each to see if that battery temp changes things. Wind especially right now is an issue as seen by the two way runs. We have 10-12mph south winds. Winds picked up again today with another big storm with large hail potential coming this afternoon. Our lakes/dams are on the brink with floodwater in the streets of some friends' houses. Glad I'm uphill from the river, but it's a weather mess the past few weeks here.