PLEASE help by reading the article, but I will summarize a bit here with copy/pasted and some of the graphics.
First the graph showing variation in power sources:
View attachment 397867
Now here are some conclusions/observations (NOT MINE):
>>> START the NOT MY ANALYSIS>>>>
“
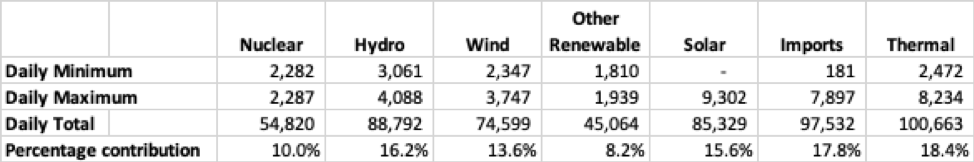
While graphs are great when you want to visualize the big picture, it's hard to beat numbers when you want to grasp the nitty-gritty. So, I've summarized critical hourly data for each class of generating assets in this table which states power in MW and energy in MWh.

The key points I noticed include:
- Power from all non-solar zero emissions sources was pretty stable on April 15th;
- PV- and thermal-solar facilities were quite productive during daylight hours but worthless during the evening demand peak when electricity was needed most;
- While the daily average CO2intensity was 36.2%, the hourly CO2 intensity was much higher during night-time hours when EVs were charging than it was during day-time hours when EVs were on the road.
As you ponder the graphs and the table, bear in mind that the simple act of plugging an EV into a wall socket is a consumption decision. Since the grid can't store power and utilities must precisely match supply and demand from moment to moment, every consumption decision requires the utility to make a corresponding production decision.
When you consider the available generating assets in CAISO's production base, it's crystal clear that imported power and local thermal-power are the only
reliable and
dispatchable generating assets that can ramp production up or down in response to consumption decisions.
- Wind power is unreliable intermittent baseload because producers cannot control the amount of electricity their wind turbines will generate at any particular time but utilities must take all electricity that wind turbines generate.
- Solar power is unreliable intermittent baseload because producers cannot control the amount of electricity their solar panels will generate at any particular time but utilities must take all electricity that solar facilities generate.
- Nuclear power is reliable stable baseload because once a decision to include nuclear power in the grid is made the plant produces electricity at a stable rate 24/7/365.
- Other renewables, including biomass, geothermal and small hydro are reliable stable baseload because they typically produce electricity at stable rates.
- Hydropower is reliable stable baseload because some producers can tune their facilities to produce less power during peak solar power intervals, but once a tuning decision is made the electricity output generally remains stable for hours.
If you give the graphs and the bullet points a few minutes (or hours, days or weeks) to sink in, the following factual statements become self-evident and incontrovertible.
- At any given moment in time, electricity production from nuclear, hydro, wind, other renewables, and solar is beyond anyone's control
- The only power production assets with the ability to respond to marginal demand are gas-fueled power plants and it doesn't matter whether the marginal demand arises at noon or midnight in San Diego, California or Bangor, Maine.
- The marginal fuel to charge an EV anywhere in the US will always be natural gas; and while increased renewables may improve grid average emissions, they cannot change the marginal fuel source for EV charging.
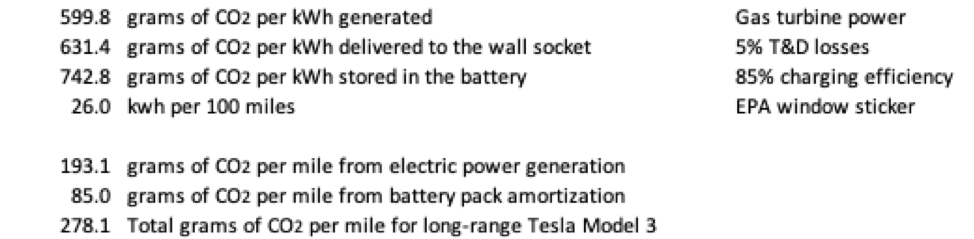
According to the US Energy Information Agency, natural gas turbines emit 599.8 grams of CO2 per kWh while more efficient combined cycle plants emit 512.4 grams of CO2 per kWh. Since combined cycle plants typically operate as baseload facilities and gas turbines typically fill the gaps between baseload and demand, I believe 600 grams of CO2 per kWh is the best figure to use for EV charging analysis.
The following table summarizes the calculations necessary to roll this number forward from the power plant to the open road in a long-range Tesla Model 3.
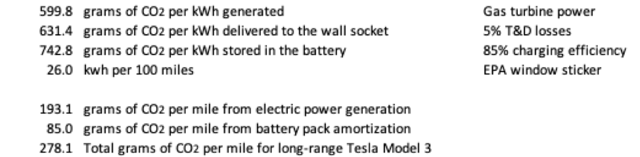
>>>>END OF NOT MY ANALYSIS>>>