RKCRLR
Active Member
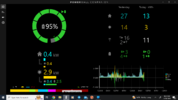
Close. The top is still cut off but I can make out the toast descriptions and it works as expected if I hide the taskbar. Its fine for my use, just letting you know if you want to something about it in the future.New version should fit a bit more in, can you try it (6.1)?
Thanks!
Last edited: