Welcome to Tesla Motors Club
Discuss Tesla's Model S, Model 3, Model X, Model Y, Cybertruck, Roadster and More.
Register

Missing negative values for Powerwall and Grid in app?

This site may earn commission on affiliate links.
Somewhere in the mobil app update in mid-July, the downloaded data for both Powerwall and Grid does not contain negative values (indicative of charging and export respectively). The data is clearly still present and charted in the app itself, just that all negative values are set to 0 in the downloaded .csv data file (I use the file from the battery as it contains all curves). It's clearly an app bug as if I use the current app to go back and download data for which I previously have full data, I also get the 0's.

I assume this will require a bug fix, but perhaps someone else has a work-around for data download as I the app is a very cumbersome way to access the historical data for off-app use?
FWIW I am still showing negative values. On Android 4.23.6
 
I assume this will require a bug fix, but perhaps someone else has a work-around for data download as I the app is a very cumbersome way to access the historical data for off-app use?

If you’re comfortable running Python scripts, I have one that will download data in bulk with more details and higher precision:

 
If you’re comfortable running Python scripts, I have one that will download data in bulk with more details and higher precision:

I use Windows, so I wrote a short description of how to use tesla-solar-download with Windows 11
 
If you’re comfortable running Python scripts, I have one that will download data in bulk with more details and higher precision:

offandonagain,

Thanks! I've managed to develop a lengthy R script to handle and chart all of my data here, but am still pretty much a novice at it. But maybe I can use Python for download? I'll take a look and see if I can figure it out?

Russ
 
Feel free to DM me if you run into any issues.
@offandonagain: Before I forget, just wanted to thank you for this python script. Had some trepidation as a non-programmer, but with a little patience, your readme file got me through all that I needed to download and install both Python 3 and git, and then through my first successful download. All the files look great and just like expected. Downloading and installing git was the hardest thing to figure out, but now done.

Now I just need to play with some paths an variable names in my R script, then I should be back in business and no longer waiting on Tesla programmers to fix the bug in the app. Meanwhile, the added precision of watts instead of kilowatts will be most welcome.

Hopefully some day soon, all of this will be made easy for everyone.
 
  • Like
Reactions: offandonagain
Feel free to DM me if you run into any issues.
@offandonagain: One comment... in the downloads I used to grab from the app, the .csv files also had a battery charge status level data curve (as % of of full). I was using this to estimate and track round trip energy efficiency by comparing with power flows. It was a minor pain as it was only recorded in 15 minutes instead of 5 min intervals, but was nice. Mostly was hoping to track any long-term degradation of my battery. I would assume getting this curve would be as simple as making the right call, but might be a feature to add in a future update if you make one? Meanwhile, not a big deal at all as this whole process is MUCH easier than I was going through before.
 
@offandonagain: One comment... in the downloads I used to grab from the app, the .csv files also had a battery charge status level data curve (as % of of full). I was using this to estimate and track round trip energy efficiency by comparing with power flows. It was a minor pain as it was only recorded in 15 minutes instead of 5 min intervals, but was nice. Mostly was hoping to track any long-term degradation of my battery. I would assume getting this curve would be as simple as making the right call, but might be a feature to add in a future update if you make one? Meanwhile, not a big deal at all as this whole process is MUCH easier than I was going through before.

Sure, that's easy to add, just did it. Pull the latest version and give it a try, the data will be in the soe directory. It's also 15min resolution, since that's how Tesla tracks it. To get all the past battery charge data, you'll have to rename or move your existing download directory, since it won't try to download data for days where you already have the power data. If you only care about data going forward, no changes are needed.

Btw to track Powerwall degradation, it might be more useful to get the full pack energy data from the batteries directly. If you don't want to deal with Gateway APIs, look at the Netzero for Tesla app (disclaimer: I wrote that).
Fabulous! Thanks! I will just remove the old directly since Im starting clean. Onward to tweak the R script today...
 
Sure, that's easy to add, just did it. Pull the latest version and give it a try, the data will be in the soe directory. It's also 15min resolution, since that's how Tesla tracks it. To get all the past battery charge data, you'll have to rename or move your existing download directory, since it won't try to download data for days where you already have the power data. If you only care about data going forward, no changes are needed.

Btw to track Powerwall degradation, it might be more useful to get the full pack energy data from the batteries directly. If you don't want to deal with Gateway APIs, look at the Netzero for Tesla app (disclaimer: I wrote that).
@offandonagain : One quick return to offer thanks once again. Took me a while to figure out an annoying time zone problem (your script now delivers data in my local time zone instead of UTC), but all good and working now. Going to be SO MUCH easier to not have to do that manual daily download from the app, and doubly nice to have the extra precision (app data rounded to 0.1 kW).

Thought you might value seeing how I use this data (so far). I combine the Tesla gateway data with data separately downloaded from

1. SolarEdge inverter - to check and calibrate the Tesla solar power values (which I presume to be most accurate). Turns out this is quite critical because the Tesla home load is net of other values, and if solar data is off, estimated home load is off (by a larger fraction). In my case, the Tesla gateway is reporting power levels ~5% too high, which when that power is properly allocated to home load can quite significant (on a sunny day). [Data download site provided by SolarEdge.]

2. Utility Smart Meter - similarly used to check any potential discrepancy between Tesla reported grid data and the actual fiscal meter also presumed more accurate. In my case, no statistically significant variance here meriting correction. [Handy public data download site here in Texas.]

3. Span Smart Power Panel Data (limited) - right now Span doesn't have a setup for direct customer data download, but I've gotten limited intervals from their help desk when trouble shooting some early problems. Allowed me to see parasitic load of that system (small, but measurable). Although my key logic in installing the Span was adding backup management flexibility, I do think in time once I get the circuit level data routinely, will enable smarter management of home loads in response to varying power surplus/deficit conditions. Can't do much until they give regular data access.

4. Weatherflow Tempest weather station - For now, just allows me to see and understand the very material impact of weather on power production and consumption. But aspiration is to couple hyper-local weather forecasting in both load and backup management (Tesla's "storm watch" is too primitive and most often too late to do any good). [Similar user-community written routine (in a "Docker" program.]

FWIW, missing for now is smart thermostat data, but hope to be able to find one that can deliver what I want in the future. Conceptually easy to see how with a bit of learning, could actively couple A/C loads to power surplus/deficit status and outlook, after all, air and walls are just a thermal battery.

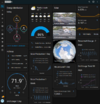
Below then some example charts of 5 minute (over narrow time window), daily and monthly data. Altogether this helps me evaluate the merits of my system design (which for now I'm quite happy with). In my best month (February here in coastal TX), I was 96% self-powered only still having to buy a little from grid even though I had a net surplus due to minute-by-minute load demand. Worst was 69% self-powered in August during the brutal summer 2023 heat dome over Texas (really visible on daily temp chart!), but even then during a few periods we were 95%+ self-powered because we were gone from the house and just turned up thermostats (to flat 78F).

More than anything, having this data has made it hugely obvious just how important having that local battery storage is to getting value out of the solar. Without that battery, I would have just been selling cheap power to the grid when the sun was shining, and bought back expensive power in the evening (like I did on the first day in below image where battery was full as backup protection due to storm passing during the night before).

More to do even with current data sets on things like battery efficiency (right now ~90% looks right), and especially interested in deep dive on economic value as I now get past my first full year of the system, but it is all only possible with data.

Kind of a shame Tesla (and others) don't make it easier already, but I am grateful that you took the time to share your code to make the critical data download step easier! Thanks again - I am back in business!
Example 5 min chart.jpg

Example daily chart.jpg

Example monthly chart.jpg
 
Thought you might value seeing how I use this data (so far).

This looks great, very comprehensive! My data analysis is not nearly as detailed, but a just a few comments and suggestions:

1. Surprising that SPAN doesn't have data downloads, I would push them on that. I use Emporia Vue, and while they don't have an official API, they sanctioned third-party tools so I can get pretty high resolution data from it.

2. One data set I would recommend adding is solar generation estimates from PVWatts. The performance of your system first and foremost relies on the PV system being operational, and when it's a single string that's underperforming, it's easy to miss the issue.

3. I hear you on smart thermostats. I spent a lot of time trying to get reliable data from my Bryant heat pump but gave up eventually.
 
  • Like
Reactions: Matt-FL
On the thermostat, I had the (mis)fortune of having to purchase a new system last year. It included an Ecobee Pro thermostat. That had direct integration into home assistant, and I purchased additional temp sensors for every major room in the house (and one in the attic, we'll see how long that lasts). I'm able to get lots of detail from the system, graphing out the differences throughout the day, along with usage other details, including air quality. Pretty happy with the integration and capability.

Couple that data with what I get from WeatherFlow (again, in Home Assistant), I can build a quick dashboard showing my home details, including the thermostat. Oh, and it also charts out my Emporia Vue data too, although the emporia data is not real time, more like 'last minute' or 'last hour'.

Here's a subset of my solar dash:
1698861265431.png


Here's a simple house temp / AC usage dash:
1698860423283.png


And Vue from the Energy Dash:
1698860495677.png
 

Attachments

  • 1698860353140.png
    1698860353140.png
    604.5 KB · Views: 20
Last edited:
  • Informative
Reactions: offandonagain
This looks great, very comprehensive! My data analysis is not nearly as detailed, but a just a few comments and suggestions:

1. Surprising that SPAN doesn't have data downloads, I would push them on that. I use Emporia Vue, and while they don't have an official API, they sanctioned third-party tools so I can get pretty high resolution data from it.

2. One data set I would recommend adding is solar generation estimates from PVWatts. The performance of your system first and foremost relies on the PV system being operational, and when it's a single string that's underperforming, it's easy to miss the issue.

3. I hear you on smart thermostats. I spent a lot of time trying to get reliable data from my Bryant heat pump but gave up eventually.
Thanks. Will definitely look into Emporia Due and PVWatts. Now that I've got data, its quite the enticement to dive in deeper!
 
  • Like
Reactions: Matt-FL
On the thermostat, I had the (mis)fortune of having to purchase a new system last year. It included an Ecobee Pro thermostat. That had direct integration into home assistant, and I purchased additional temp sensors for every major room in the house (and one in the attic, we'll see how long that lasts). I'm able to get lots of detail from the system, graphing out the differences throughout the day, along with usage other details, including air quality. Pretty happy with the integration and capability.

Couple that data with what I get from WeatherFlow (again, in Home Assistant), I can build a quick dashboard showing my home details, including the thermostat. Oh, and it also charts out my Emporia Vue data too, although the emporia data is not real time, more like 'last minute' or 'last hour'.

Here's a subset of my solar dash:
View attachment 987073

Here's a simple house temp / AC usage dash:
View attachment 987069

And Vue from the Energy Dash:
View attachment 987070
Very cool dashboard. I can totally see a quicklook dash-board as a great tool, so feels like time soon to dive into HA. Pretty sure it was the Home Assistant forum where I found some good leads on people doing Span integration through a pilot API, so that may help solve that, too?

Good also to know that the Ecobee Pro can integrate at least via that pathway as it was the EB system that I've found most impressive so far. Might have pulled the trigger already until discovering the apparently superfluous Honeywell central management interface may actually be controlling one return air damper I was not even aware of.
 
  • Like
Reactions: Matt-FL